Fig. 10
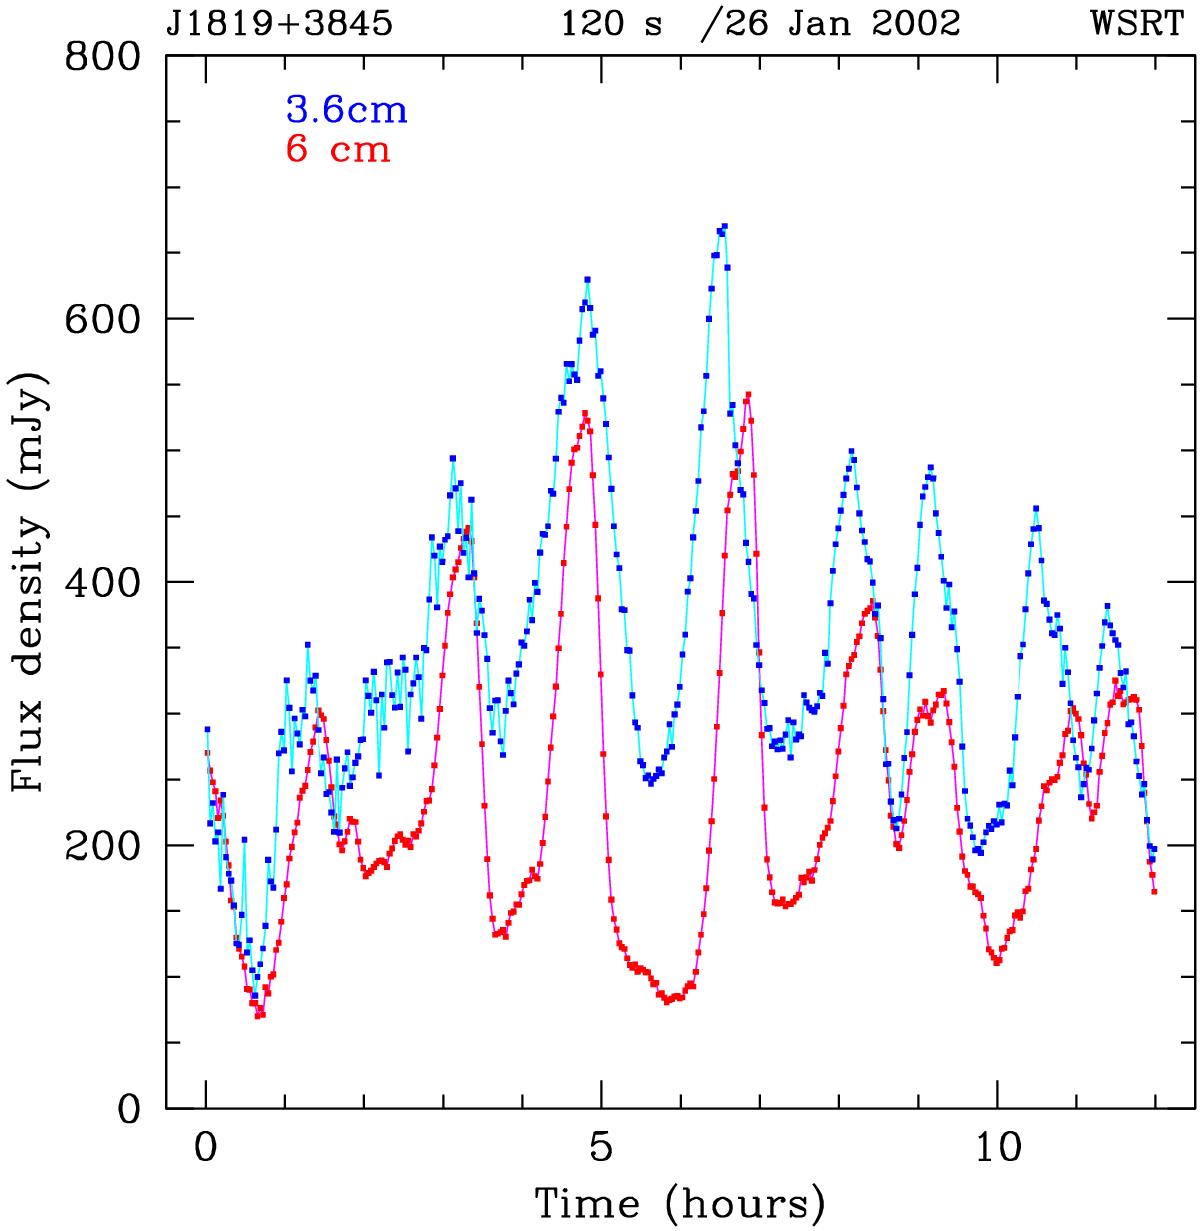
3.6 cm and 6 cm lightcurves of J1819+3845 on 26 January 2002. Typical uncertainties on the 120 s averages are about 4 mJy for 3.6 cm and 1 mJy for 6 cm. This does not include systematic flux calibration errors, which we estimate at 4% for 3.6 cm and 2% for 6 cm. There appears to be a systematic time delay of about 10 min between the peaks of the scintles, with the 6 cm scintles lagging. In addition there appears to be a systematic asymmetry in the profiles near the peak, similar to that seen on many other occasions, see e.g. Fig. 11.
Current usage metrics show cumulative count of Article Views (full-text article views including HTML views, PDF and ePub downloads, according to the available data) and Abstracts Views on Vision4Press platform.
Data correspond to usage on the plateform after 2015. The current usage metrics is available 48-96 hours after online publication and is updated daily on week days.
Initial download of the metrics may take a while.