Free Access
Fig. 1
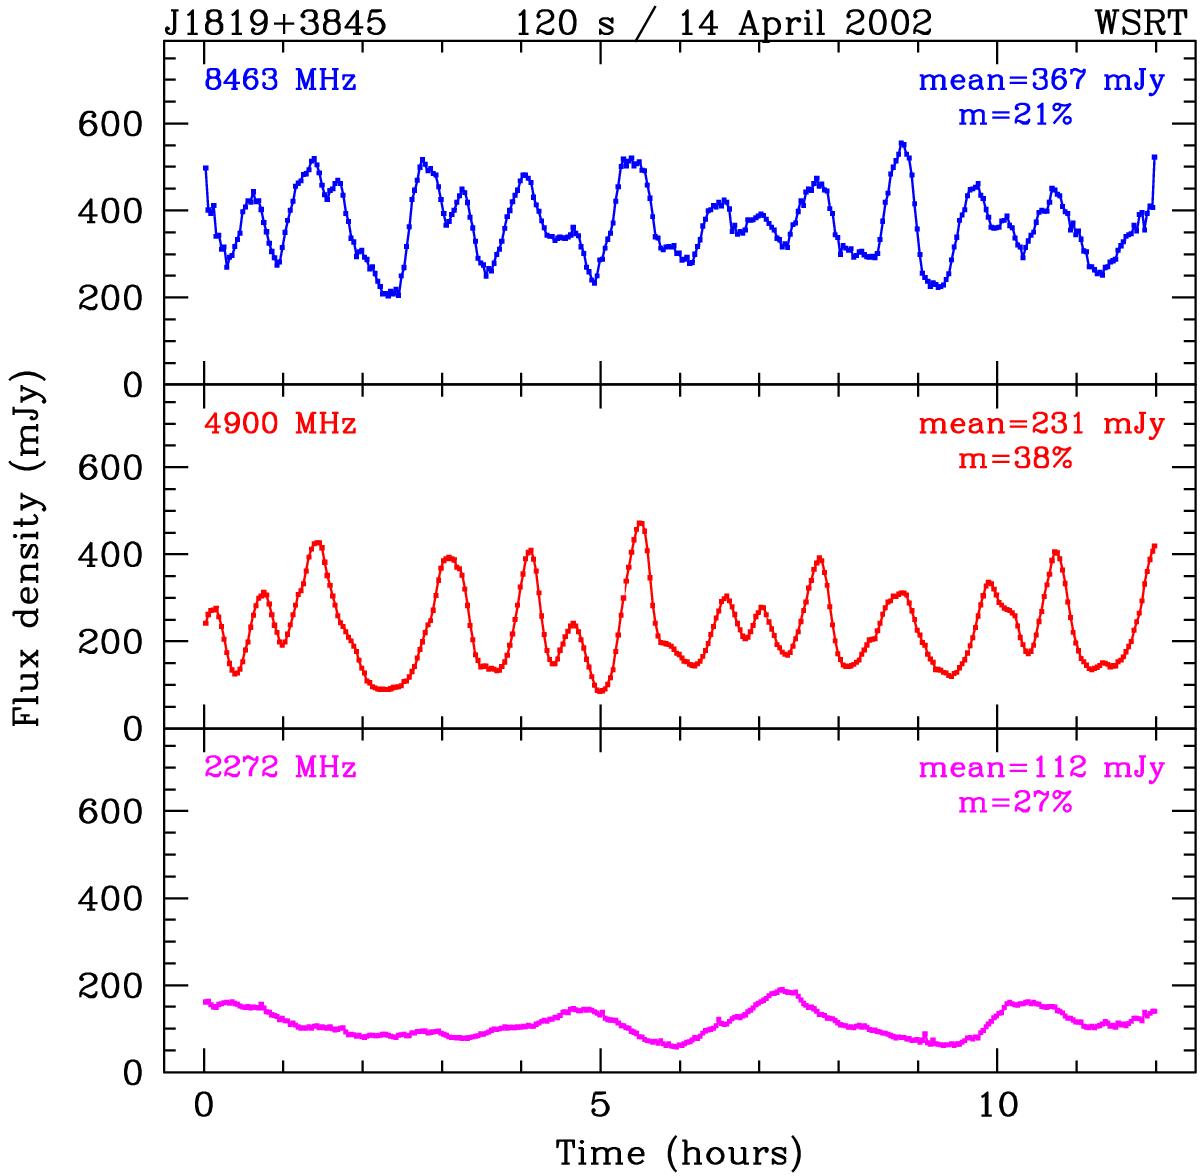
Variations displayed by J1819+3845 at 13, 6, and 3.6 cm wavelengths on 14 April 2002. The averaging time was 120 s. Note the good correlation between the lightcurves at 3.6 and 6 cm, where the scintillations are in the weak regime.
Current usage metrics show cumulative count of Article Views (full-text article views including HTML views, PDF and ePub downloads, according to the available data) and Abstracts Views on Vision4Press platform.
Data correspond to usage on the plateform after 2015. The current usage metrics is available 48-96 hours after online publication and is updated daily on week days.
Initial download of the metrics may take a while.