Fig. 3
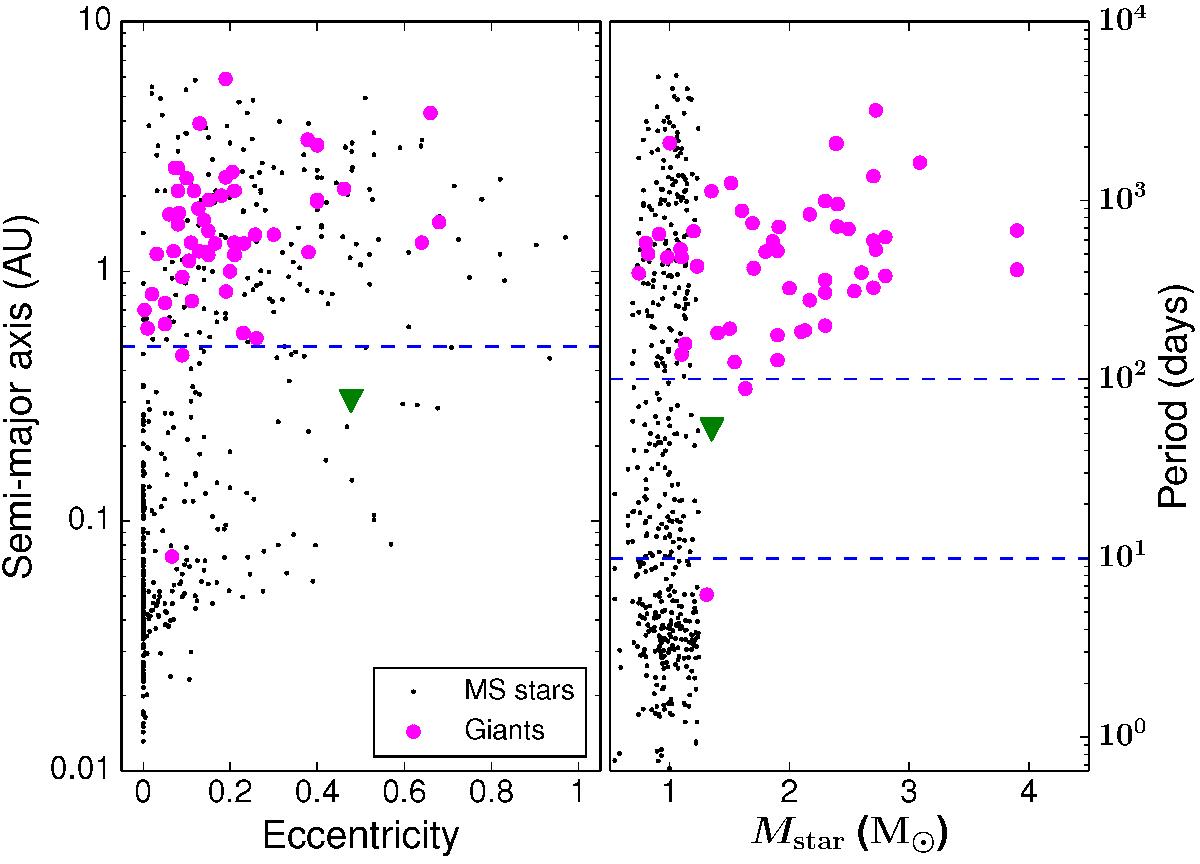
Left panel: eccentricity and semi-major axis of the extrasolar planets discovered around MS stars (black dots) and giant stars (magenta circles). The dashed line shows the value of a = 0.5 AU. Right panel: orbital period versus stellar mass. The dashed lines represent the region of 10 ≤ Porb ≤ 100 days. The position of Kepler-432 b is marked with a green triangle in both panels.
Current usage metrics show cumulative count of Article Views (full-text article views including HTML views, PDF and ePub downloads, according to the available data) and Abstracts Views on Vision4Press platform.
Data correspond to usage on the plateform after 2015. The current usage metrics is available 48-96 hours after online publication and is updated daily on week days.
Initial download of the metrics may take a while.