Fig. 9
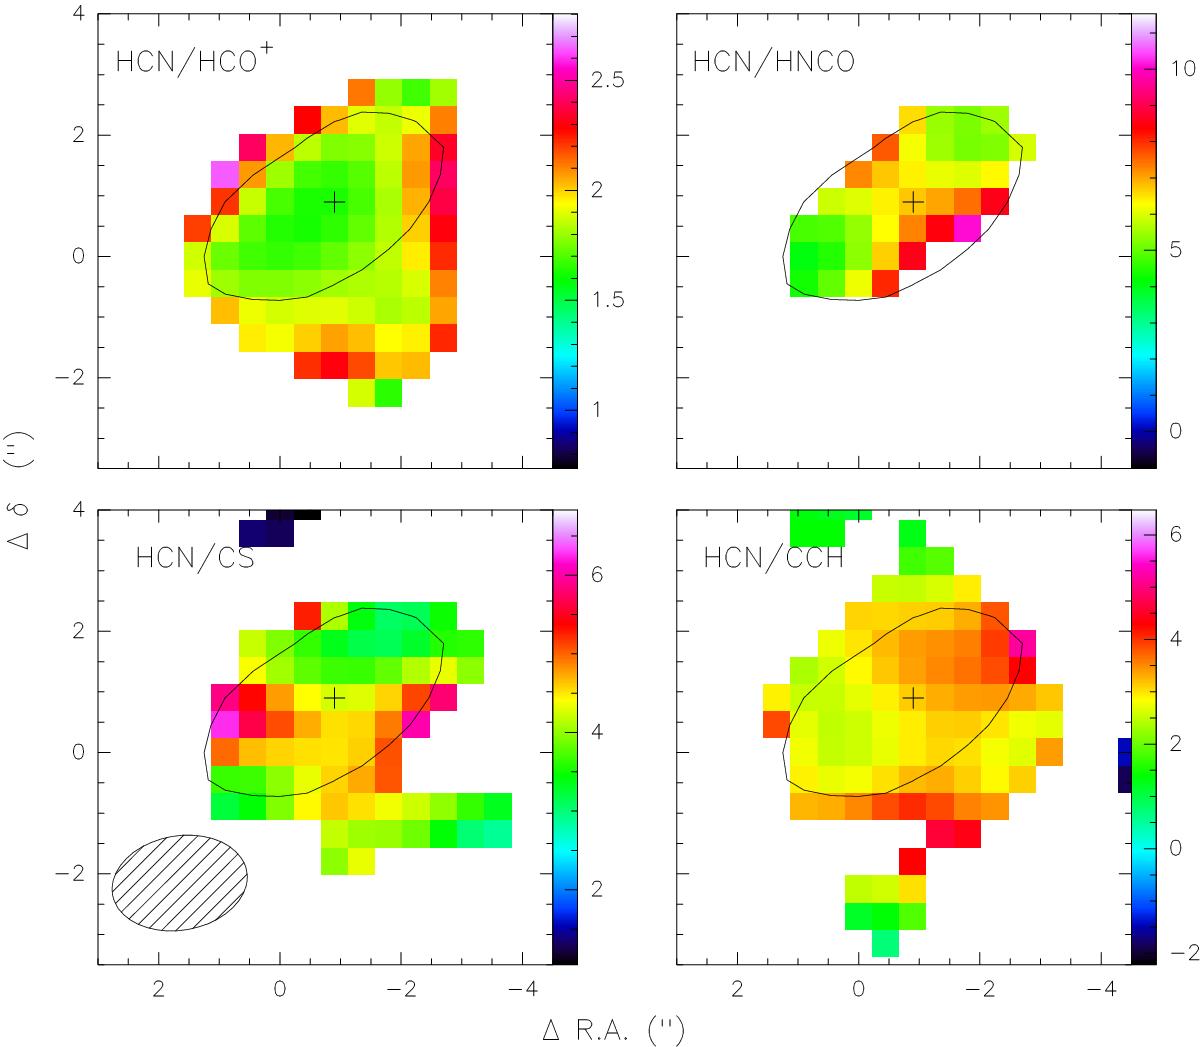
Integrated intensity line ratios of HCN over HCO+, HNCO, CS and CCH in the central ~500 pc of NGC 1097. Position of peak of molecular emission is marked with a cross. The 3σ contour of HNCO emission, delineating the circumnuclear disk around the AGN, is overlaid as a reference. Synthesized beam size is represented in the bottom left box.
Current usage metrics show cumulative count of Article Views (full-text article views including HTML views, PDF and ePub downloads, according to the available data) and Abstracts Views on Vision4Press platform.
Data correspond to usage on the plateform after 2015. The current usage metrics is available 48-96 hours after online publication and is updated daily on week days.
Initial download of the metrics may take a while.