Free Access
Fig. 5
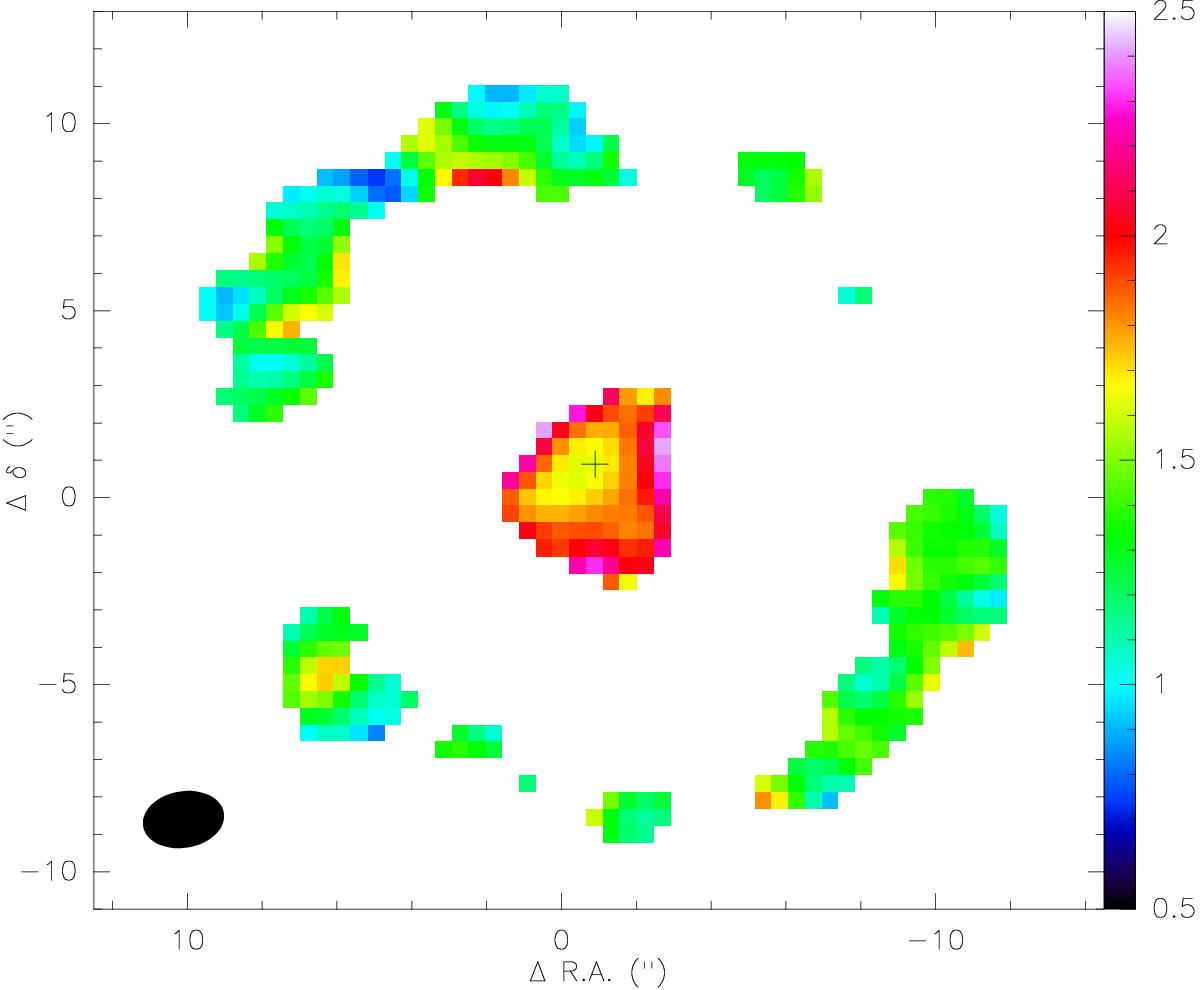
Integrated intensity HCN-to-HCO+ line ratio. Values only above 5σ in the individual integrated images has been used in this map. The position of the peak of molecular emission is shown with a cross. Synthesized beam size is represented in the bottom left corner.
Current usage metrics show cumulative count of Article Views (full-text article views including HTML views, PDF and ePub downloads, according to the available data) and Abstracts Views on Vision4Press platform.
Data correspond to usage on the plateform after 2015. The current usage metrics is available 48-96 hours after online publication and is updated daily on week days.
Initial download of the metrics may take a while.