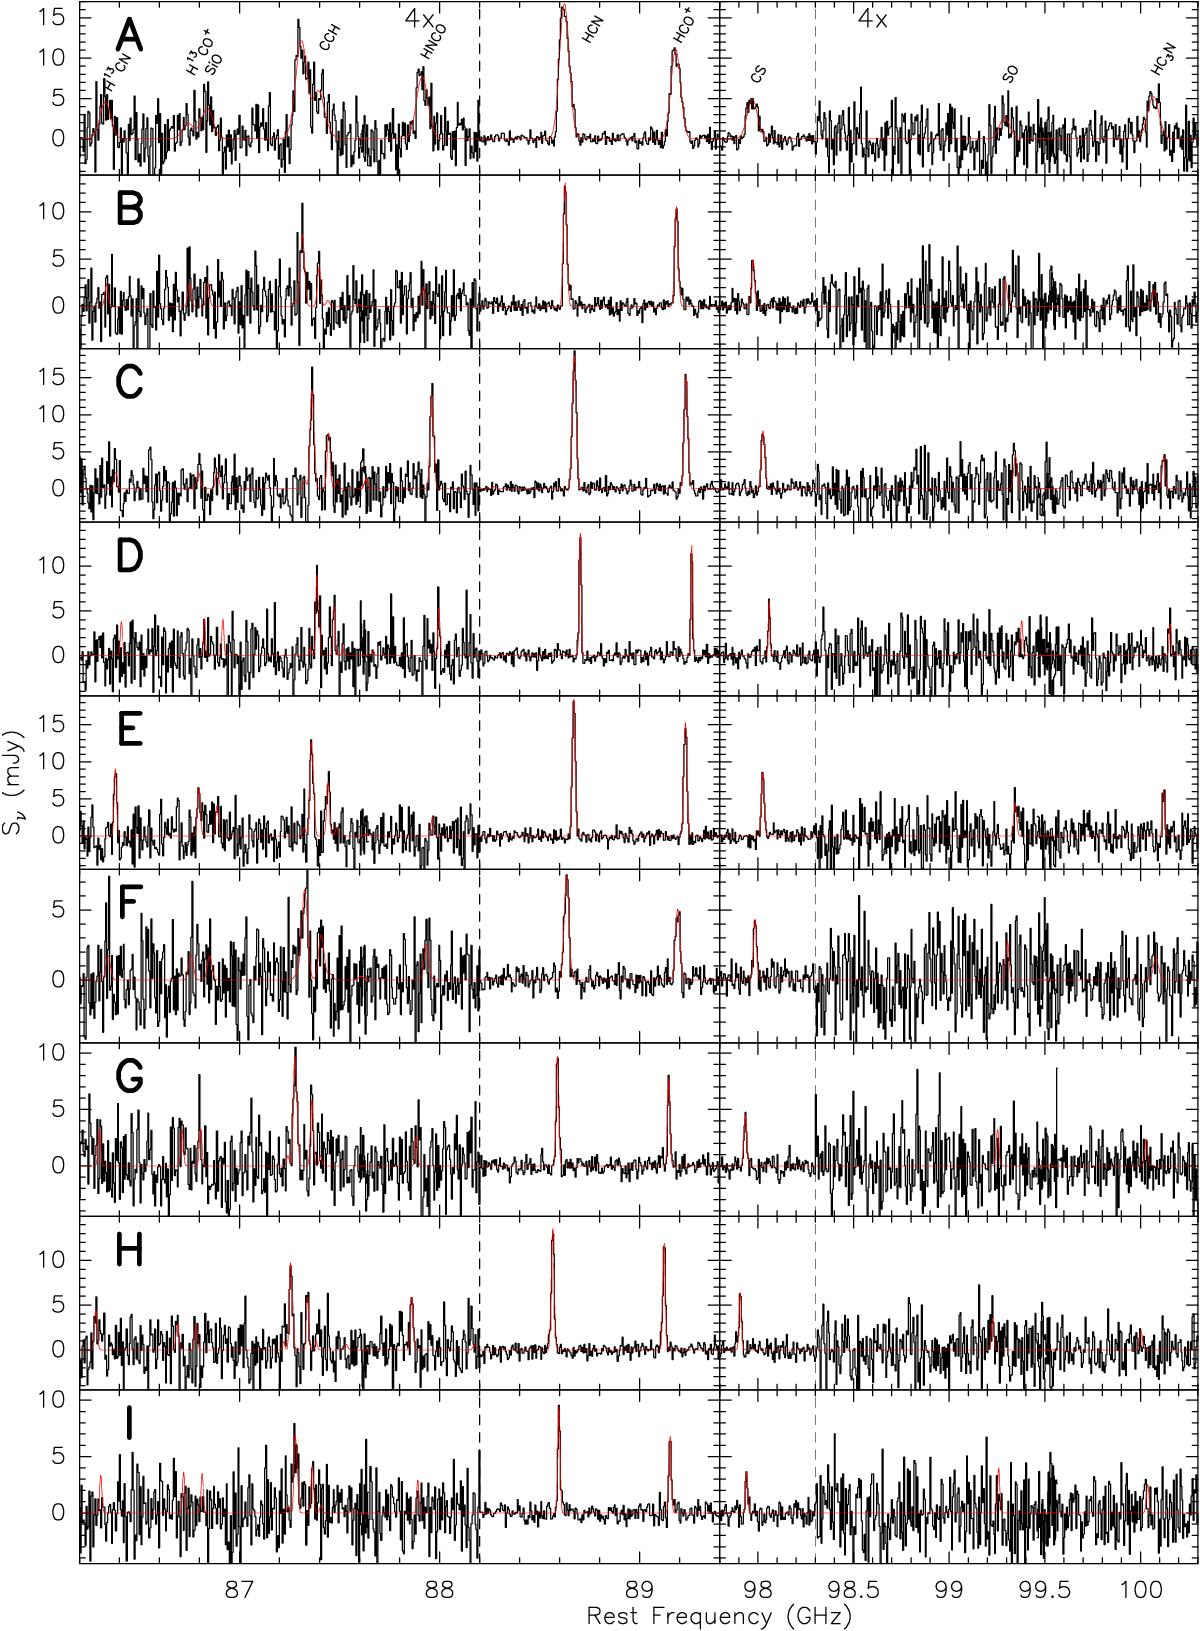
Fig. 3

Spectra extracted from selected positions in the AGN position (A) and on the SF ring (B-I) of NGC 1097. Frequency span has been cropped with respect to that of Fig. 1 removing the line free frequencies at the edges of both sidebands. Flux density scale has been multiplied by a factor of ×4 in the regions (defined by the vertical dashed lines) containing the fainter lines to improve their visualization. Molecular fit to the observed emission is represented by the red line. Non-detections are presented as the 3σ limit Gaussian profiles.
Current usage metrics show cumulative count of Article Views (full-text article views including HTML views, PDF and ePub downloads, according to the available data) and Abstracts Views on Vision4Press platform.
Data correspond to usage on the plateform after 2015. The current usage metrics is available 48-96 hours after online publication and is updated daily on week days.
Initial download of the metrics may take a while.


