Fig. 2
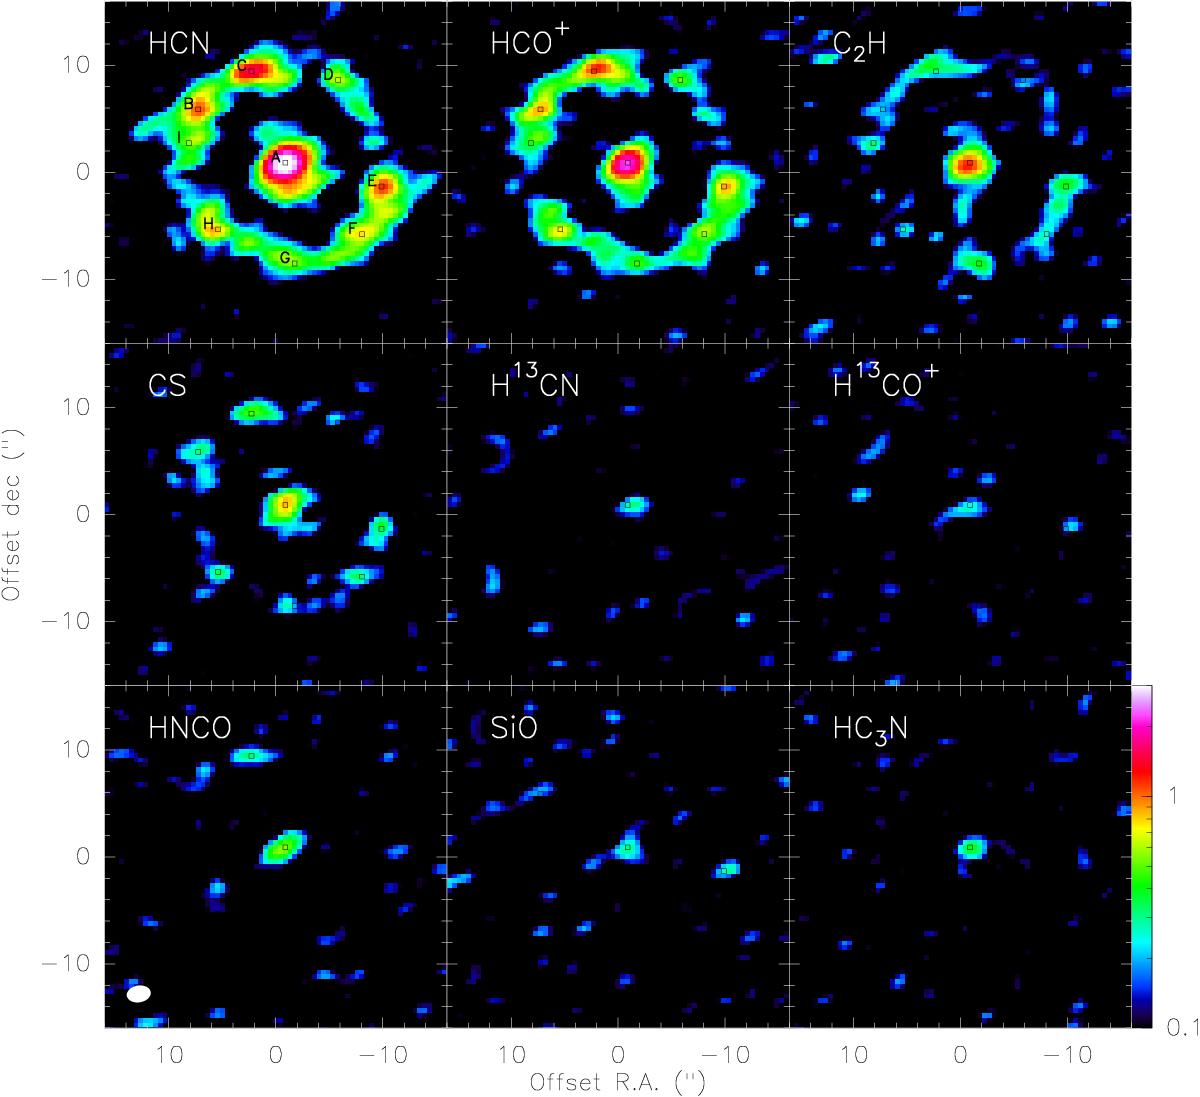
Moment 0 maps of all detected species in the velocity range [900−1600] km s-1, except for CCH where a range [600−1600] km s-1 was used to include the two groups of hyperfine components. The 1σ noise level in the integrated maps is 62 mJy km s-1 for all species, but for CCH which is 77 mJy km s-1. Logarithmic color scale is set to allow a direct comparison of the emission of the different species. Color levels are set to a minimum of 0.1 mJy km s-1 so that emission over 3σ level is seen above the black background. Positions where spectra were extracted are marked in all boxes, and labeled in the upper left box.
Current usage metrics show cumulative count of Article Views (full-text article views including HTML views, PDF and ePub downloads, according to the available data) and Abstracts Views on Vision4Press platform.
Data correspond to usage on the plateform after 2015. The current usage metrics is available 48-96 hours after online publication and is updated daily on week days.
Initial download of the metrics may take a while.