Fig. B.1
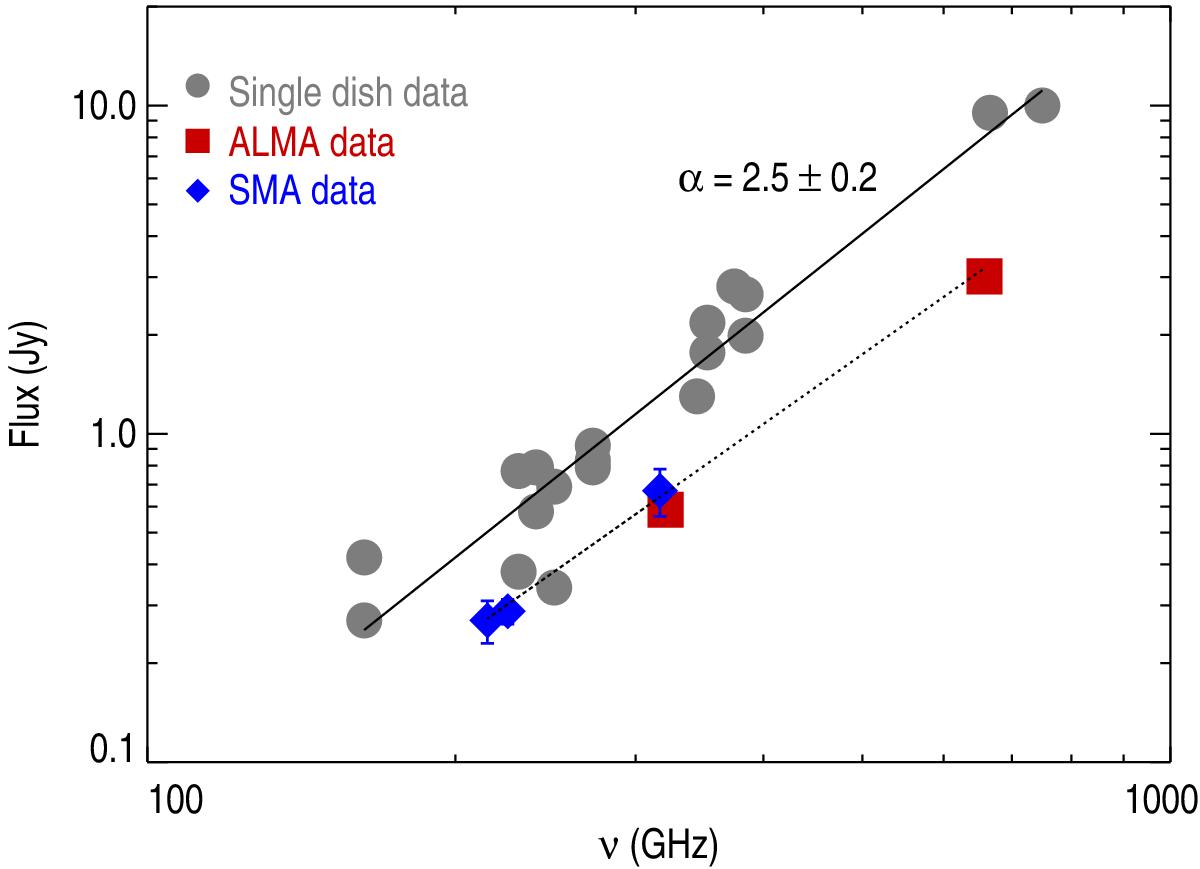
Compilation of the single dish bolometer and interferometric mm/sub-mm continuum observations of VY CMa. The gray filled circles are single-dish flux density measurements, while the blue filled diamonds and the red filled squares are interferometric measurements. The solid line indicates the spectral index fit to the single-dish observations, with α = 2.5 ± 0.2, while the dotted line is a linear fit to the interferometric observations.
Current usage metrics show cumulative count of Article Views (full-text article views including HTML views, PDF and ePub downloads, according to the available data) and Abstracts Views on Vision4Press platform.
Data correspond to usage on the plateform after 2015. The current usage metrics is available 48-96 hours after online publication and is updated daily on week days.
Initial download of the metrics may take a while.