Fig. 2
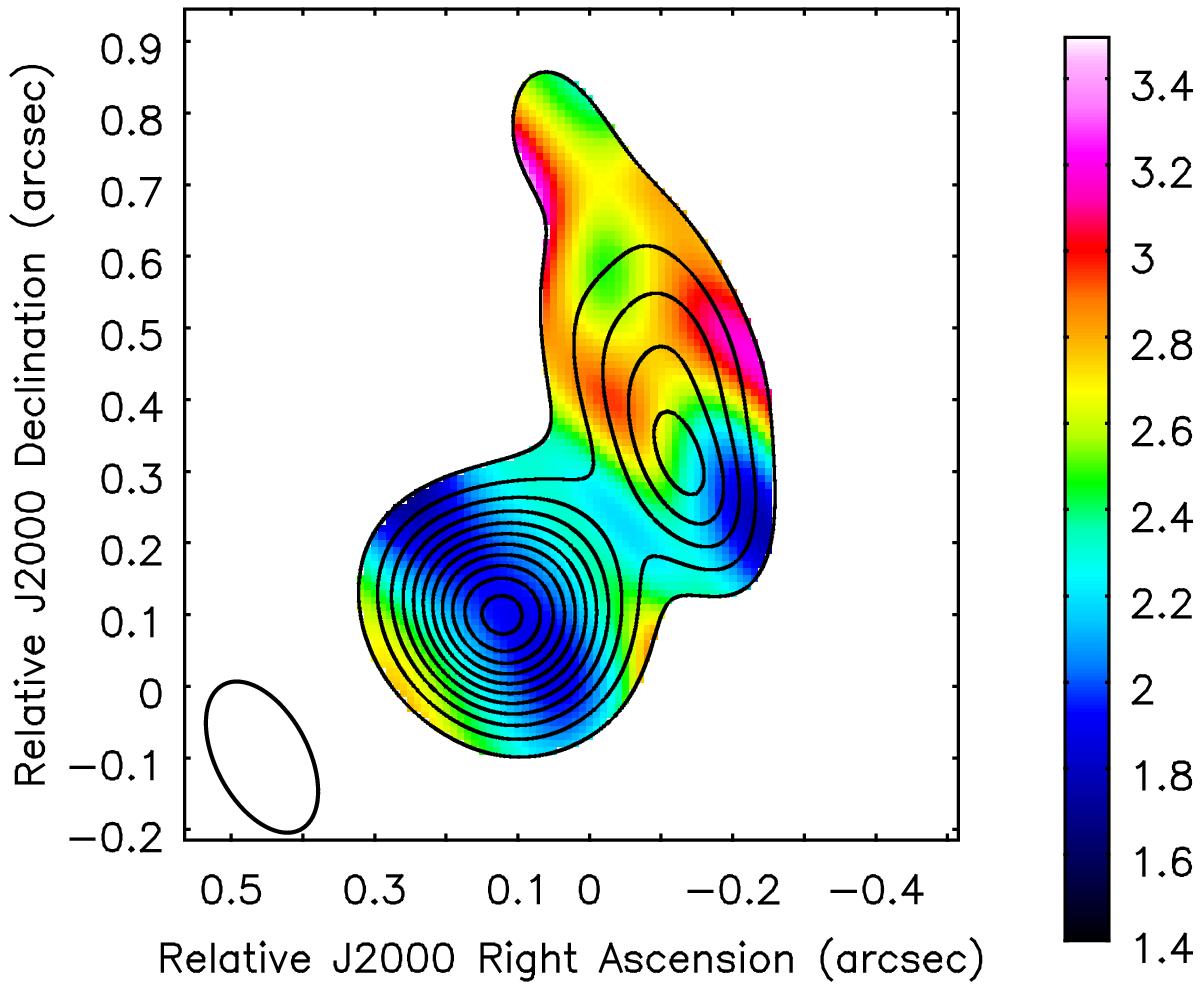
Spectral index map derived from the 321 GHz and 658 GHz ALMA continuum maps. The strongest continuum component has a spectral index α = 1.9 ± 0.05 at the peak, and the weaker elongated emission has a typical spectral index α = 2.7 ± 0.1. The error values here do not include the systematic error based on the ± 15% uncertainty of the absolute flux calibration, which is in the same direction for both regions of the image. The contour map represents the 658 GHz map, which was convolved with the 321 GHz restoring beam to create the spectral index map. Contour levels are set at [6,9,...,39] × σrms.
Current usage metrics show cumulative count of Article Views (full-text article views including HTML views, PDF and ePub downloads, according to the available data) and Abstracts Views on Vision4Press platform.
Data correspond to usage on the plateform after 2015. The current usage metrics is available 48-96 hours after online publication and is updated daily on week days.
Initial download of the metrics may take a while.