Fig. 9
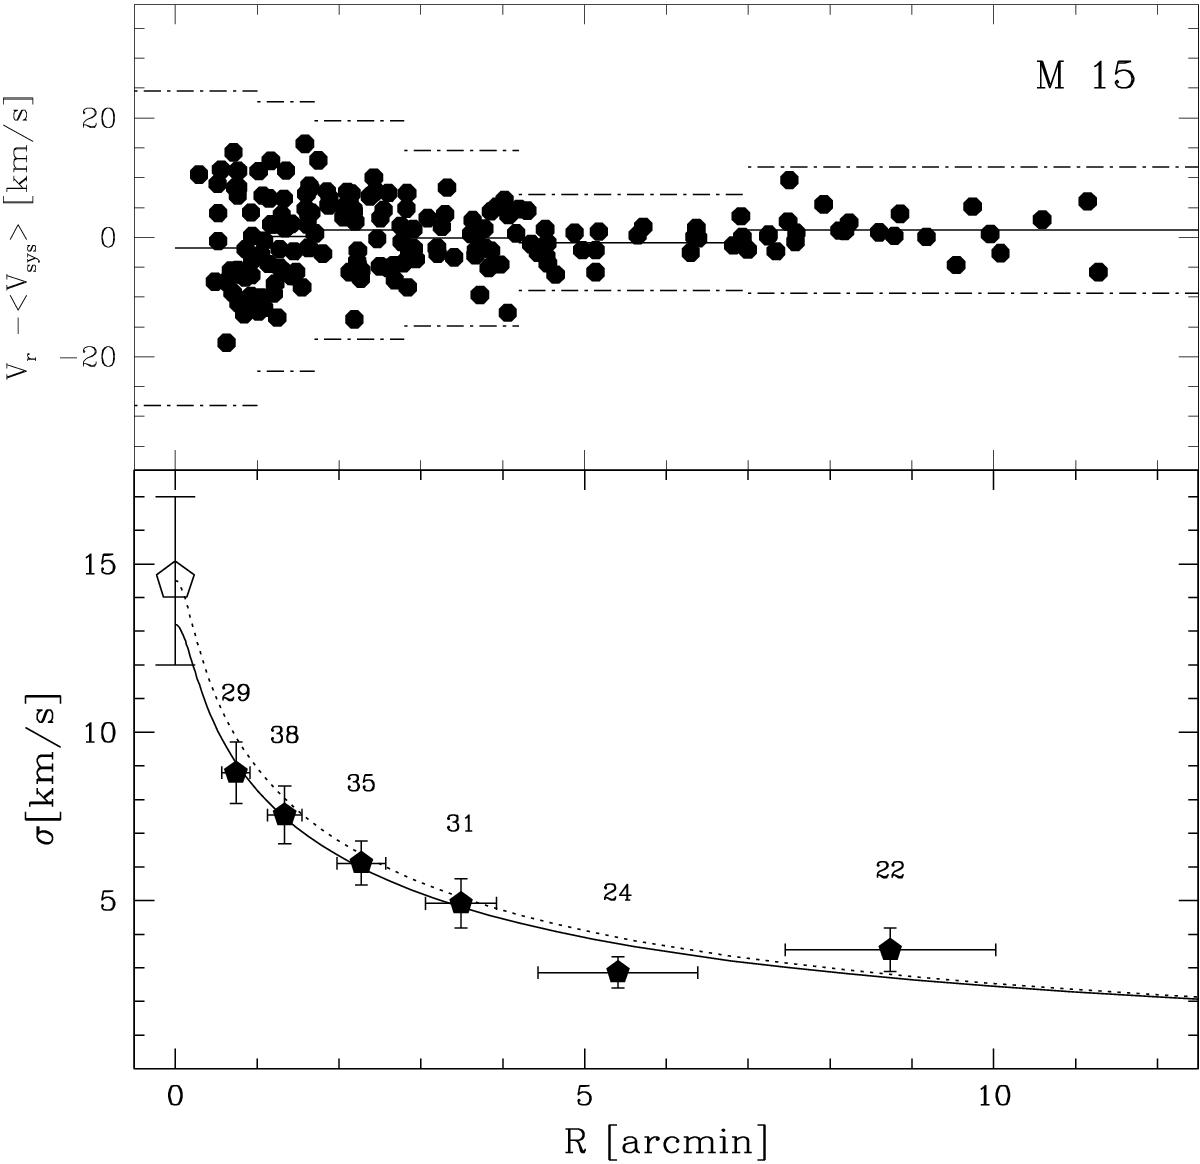
Velocity dispersion profile of M 15 stars. The upper panel shows the Vr distribution as a function of distance from the cluster centre for individual stars of the sample. Only stars plotted as dots are retained to compute σ in the various radial bins: crosses are stars rejected only because they are local 3σ outliers of the bins. The mean Vr − ⟨ Vsys ⟩ is marked by the continuous horizontal line. Comparison of the observed velocity dispersion profile of M 15 with the King model with a core radius rC = 0.07′and a concentration C = 2.5, from Trager et al. (1993) and normalised to σ0 = 13.2 km s-1 (continuous line; our estimate) and σ0 = 14.5 km s-1 (dotted line; by McNamara et al. 2003). The large filled pentagons are the dispersions estimated in the corresponding bins displayed in the upper panel, with their bootstrapped errors. The number of stars per bin is also reported above the points. The open pentagon is the value of σ at the centre of M 15 from McNamara et al. (2003).
Current usage metrics show cumulative count of Article Views (full-text article views including HTML views, PDF and ePub downloads, according to the available data) and Abstracts Views on Vision4Press platform.
Data correspond to usage on the plateform after 2015. The current usage metrics is available 48-96 hours after online publication and is updated daily on week days.
Initial download of the metrics may take a while.