Fig. 8
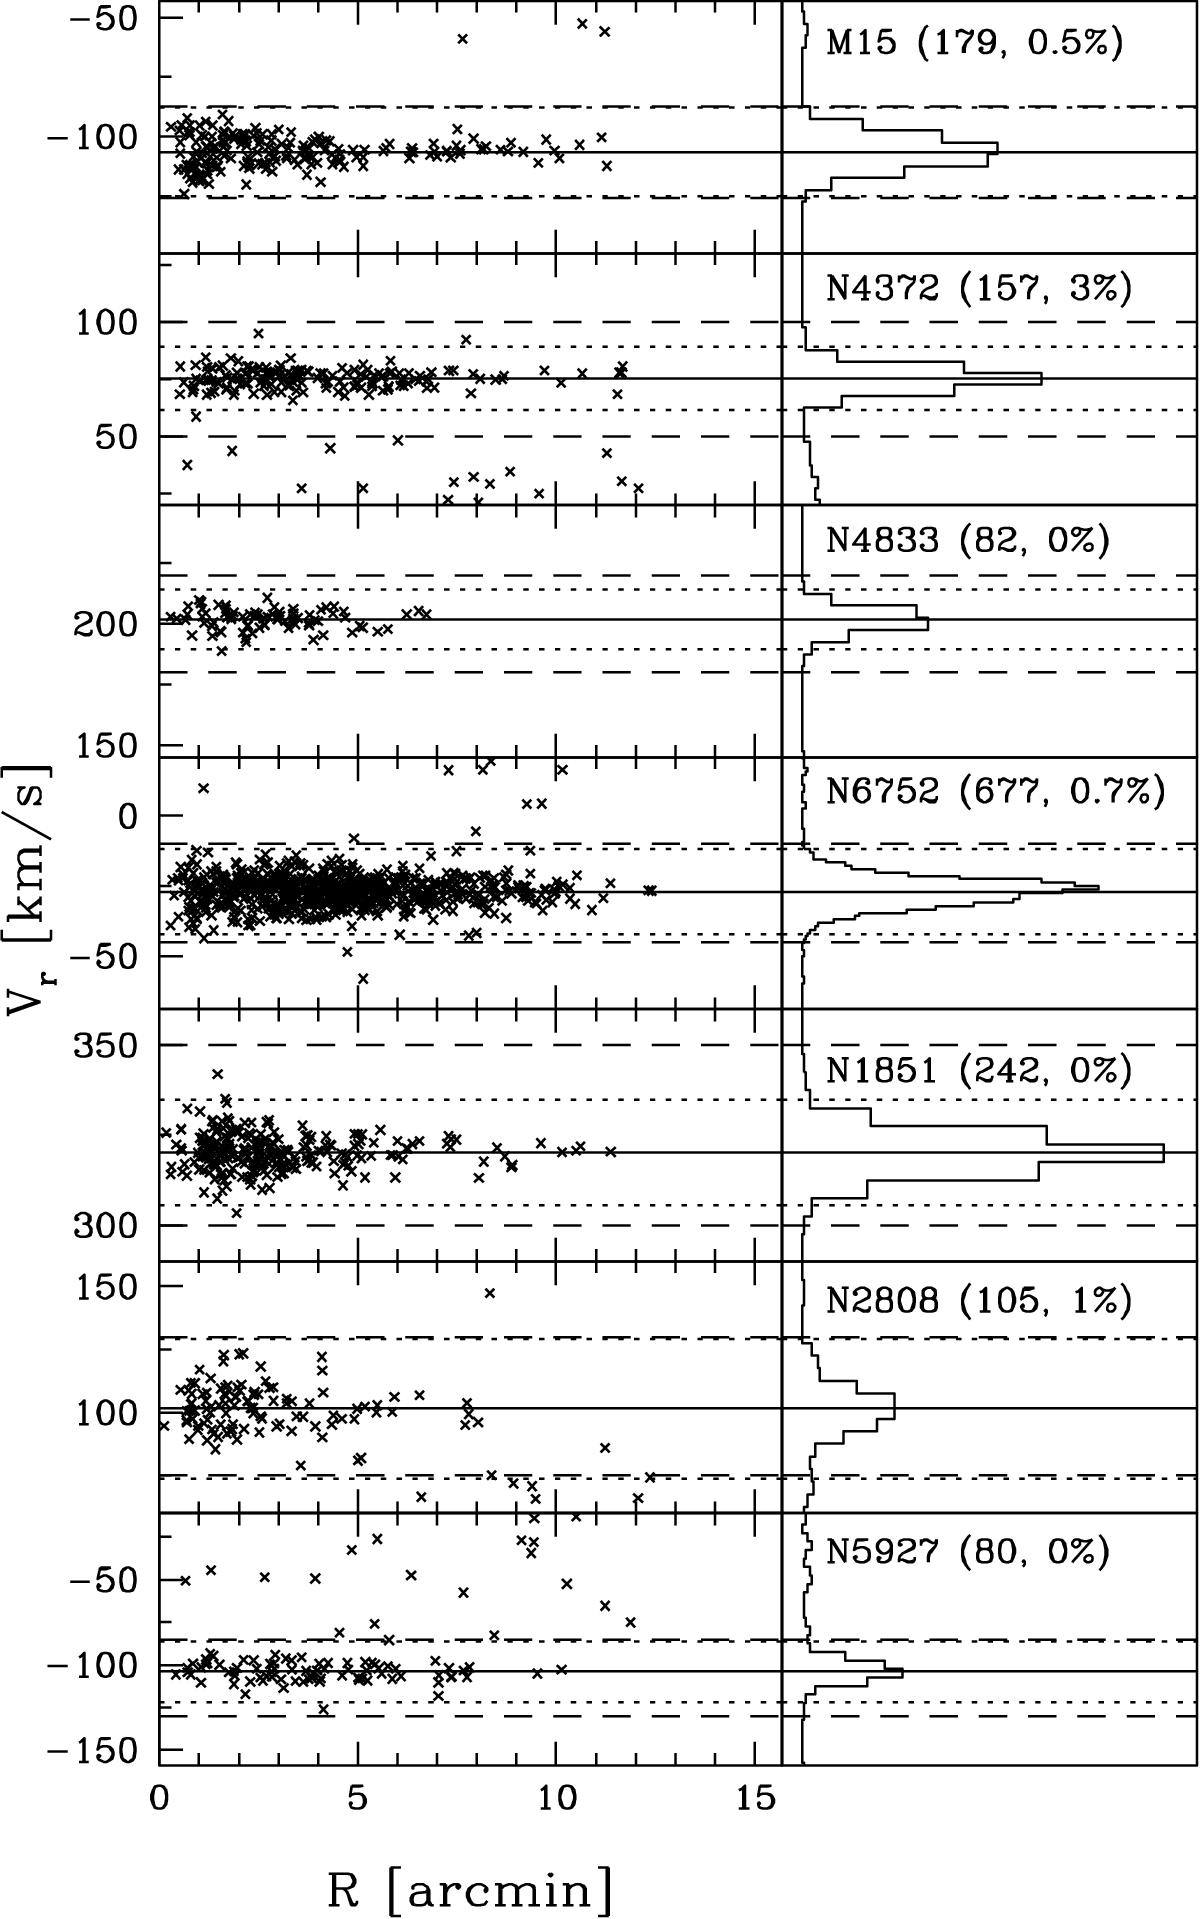
Radial velocity of program stars as a function of distance from the center (left-hand panel) for all the considered clusters, and radial velocity distribution (right-hand panel). The long-dashed lines mark the range we adopted for the first selection of candidate cluster members. The dotted lines enclose the (global) ±3σ range from the mean of the selected samples of candidates (continuous line), their number size is also indicated in the right-hand panel, along with the percentage of expected contaminants from the Besançon models (see text).
Current usage metrics show cumulative count of Article Views (full-text article views including HTML views, PDF and ePub downloads, according to the available data) and Abstracts Views on Vision4Press platform.
Data correspond to usage on the plateform after 2015. The current usage metrics is available 48-96 hours after online publication and is updated daily on week days.
Initial download of the metrics may take a while.