Fig. 5
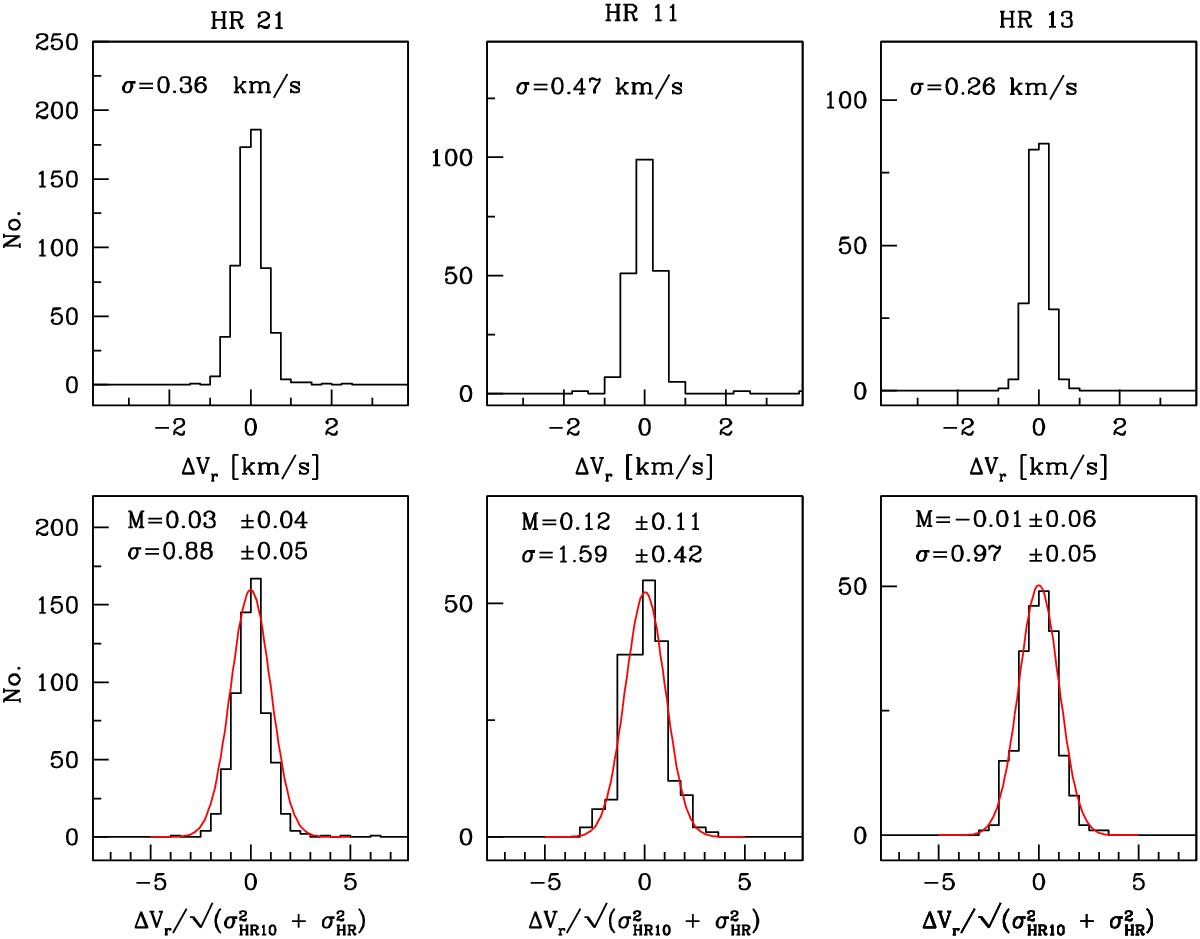
Comparison between velocity measurements for stars observed in two Giraffe setups. Upper panels: we show the distribution of velocity differences with respect to the velocity measured with HR 10 for all the stars observed (from left to right, with HR 21, HR 11 and HR 13) and estimated uncertainties on Vr ≤ 1 km s-1 for each measurement. The mean difference and the rms dispersion are also shown. Bottom panels: as above, but now the velocity difference is normalised by the predicted uncertainty. It can be appreciated that the measured uncertainty in the velocity distribution is very close to the unit variance Gaussian (standard deviation =0.88, 1.59, and 0.97 for HR 21, HR 11, and HR 13, respectively).
Current usage metrics show cumulative count of Article Views (full-text article views including HTML views, PDF and ePub downloads, according to the available data) and Abstracts Views on Vision4Press platform.
Data correspond to usage on the plateform after 2015. The current usage metrics is available 48-96 hours after online publication and is updated daily on week days.
Initial download of the metrics may take a while.