Fig. 18
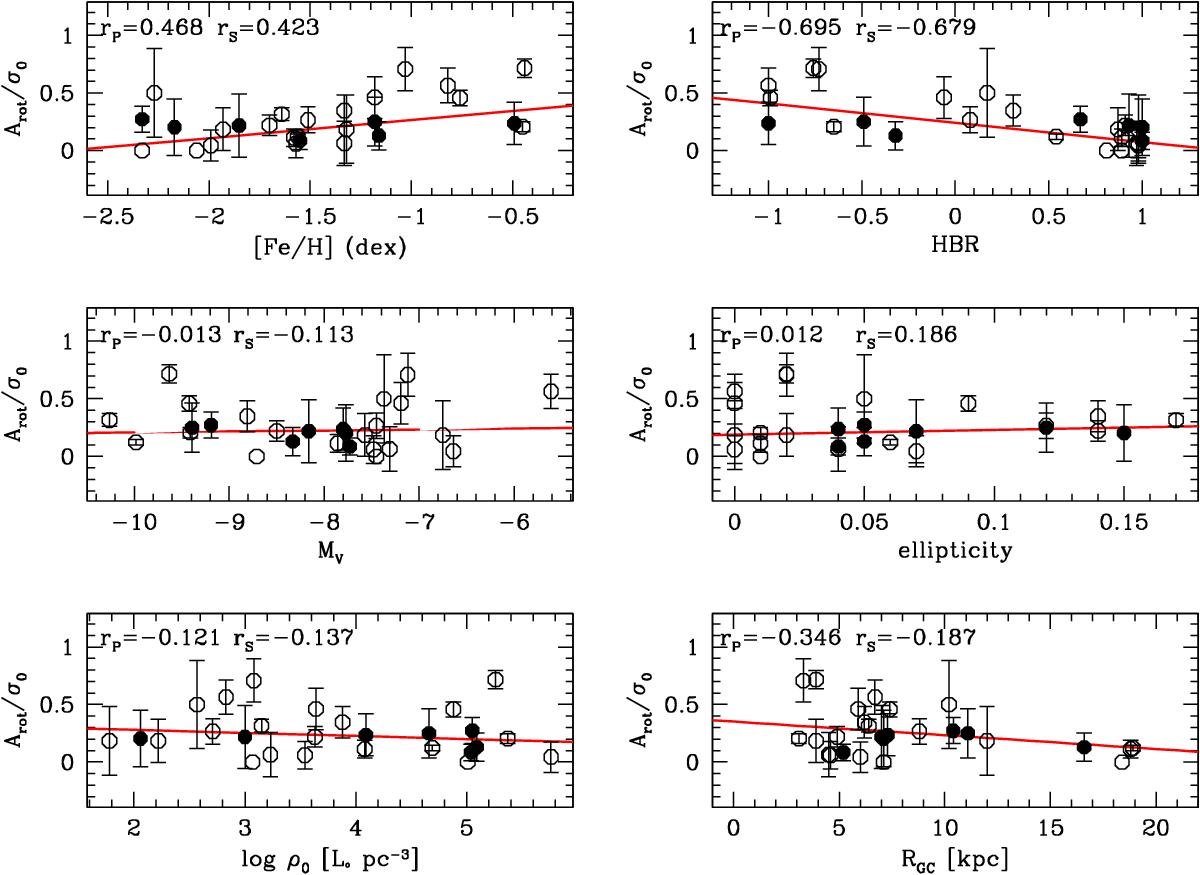
Ratio between the amplitude of the rotation Arot and the central velocity dispersion σ0 versus various other parameters. Red lines mark weighted linear fits to the clusters, and the correlation coefficients are reported at the top of each panel: rS stands for the Spearman and rP for the Pearson coefficient. Empty circles are data from B12, while filled circles are our own estimates.
Current usage metrics show cumulative count of Article Views (full-text article views including HTML views, PDF and ePub downloads, according to the available data) and Abstracts Views on Vision4Press platform.
Data correspond to usage on the plateform after 2015. The current usage metrics is available 48-96 hours after online publication and is updated daily on week days.
Initial download of the metrics may take a while.