Fig. 17
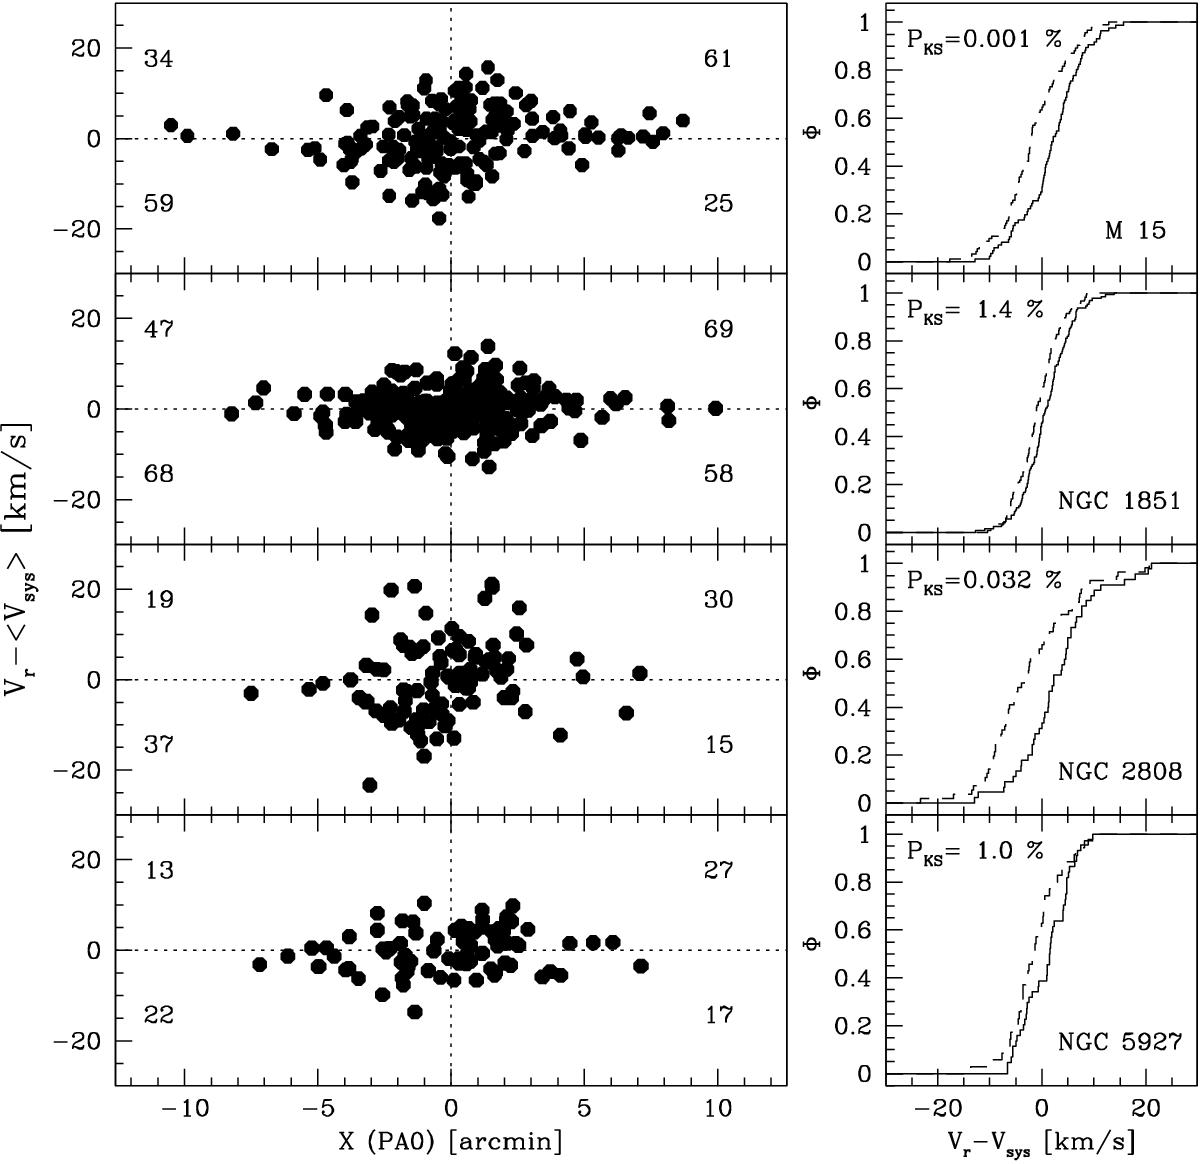
Rotation curves for M 15, NGC 1851, NGC 2808, and NGC 5927. Left panels: Vr in the system of the cluster as a function of distance from the centre projected onto the axis perpendicular to the best-fit rotation axis found in Fig. 16. The number of stars in each quadrant is also shown. Right panels: comparison of the cumulative Vr distributions of stars with X(PA0) > 0.0 (continuous lines) and X(PA0) < 0.0 (dashed lines). The probability that the two distributions are drawn from the same parent population (according to a KS test) is reported in each panel. We show rotation curves only for the four clusters with PKS< 2.5%.
Current usage metrics show cumulative count of Article Views (full-text article views including HTML views, PDF and ePub downloads, according to the available data) and Abstracts Views on Vision4Press platform.
Data correspond to usage on the plateform after 2015. The current usage metrics is available 48-96 hours after online publication and is updated daily on week days.
Initial download of the metrics may take a while.