Fig. 1
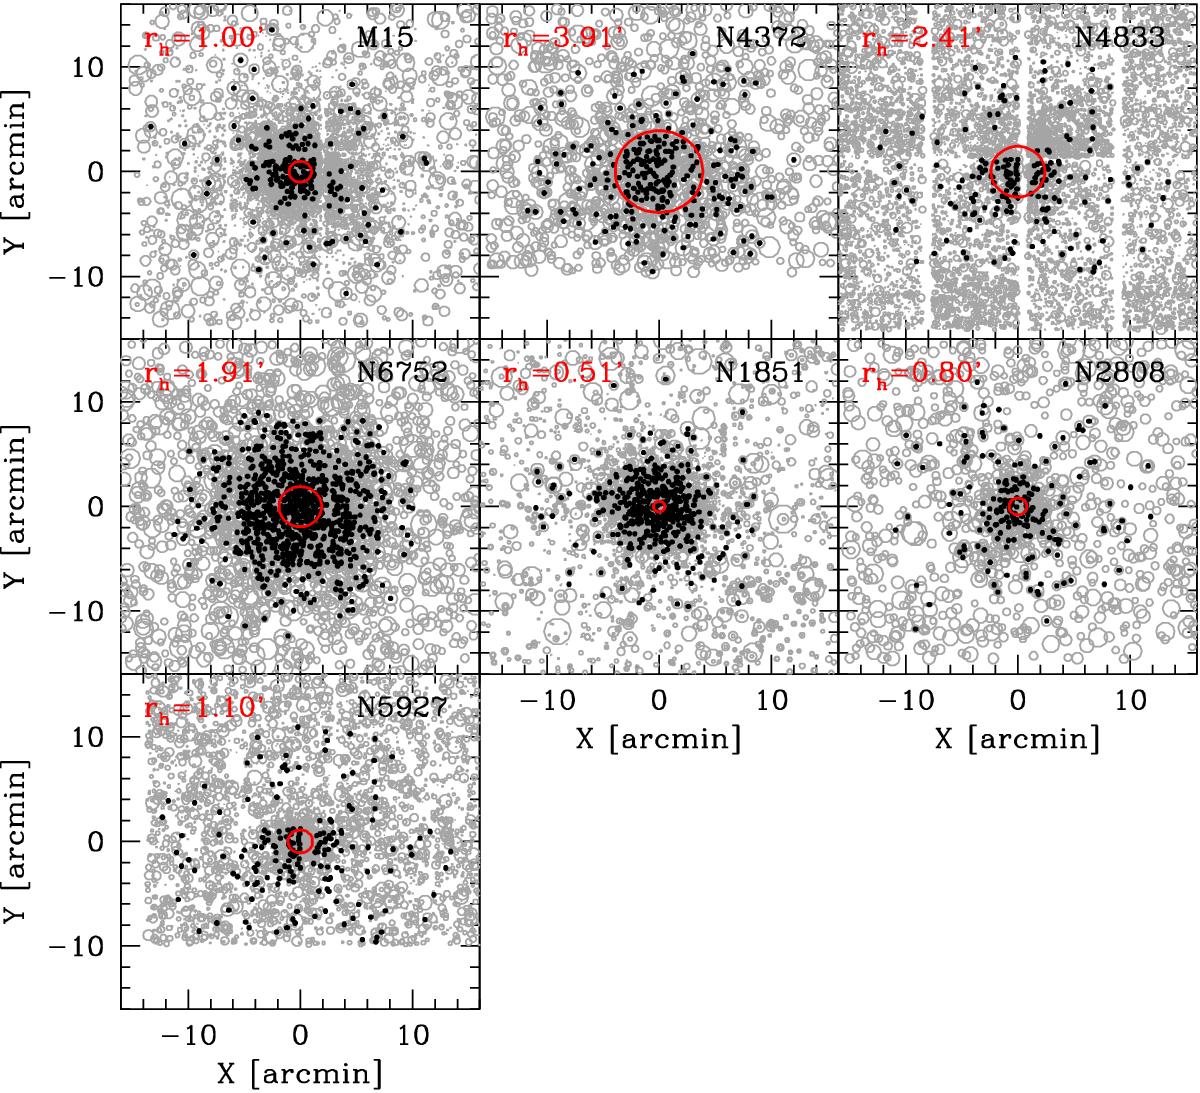
Spatial distribution of the initial sample (black dots) overlaid on our WFI photometry (grey circles). The half-light radius (from Harris 1996; 2010 edition) is also reported and plotted as a red line. Note that the stars plotted here are all the stars retrieved from the CASU archive before Galactic contaminants were removed and sample selection was made (see text).
Current usage metrics show cumulative count of Article Views (full-text article views including HTML views, PDF and ePub downloads, according to the available data) and Abstracts Views on Vision4Press platform.
Data correspond to usage on the plateform after 2015. The current usage metrics is available 48-96 hours after online publication and is updated daily on week days.
Initial download of the metrics may take a while.