Fig. 9
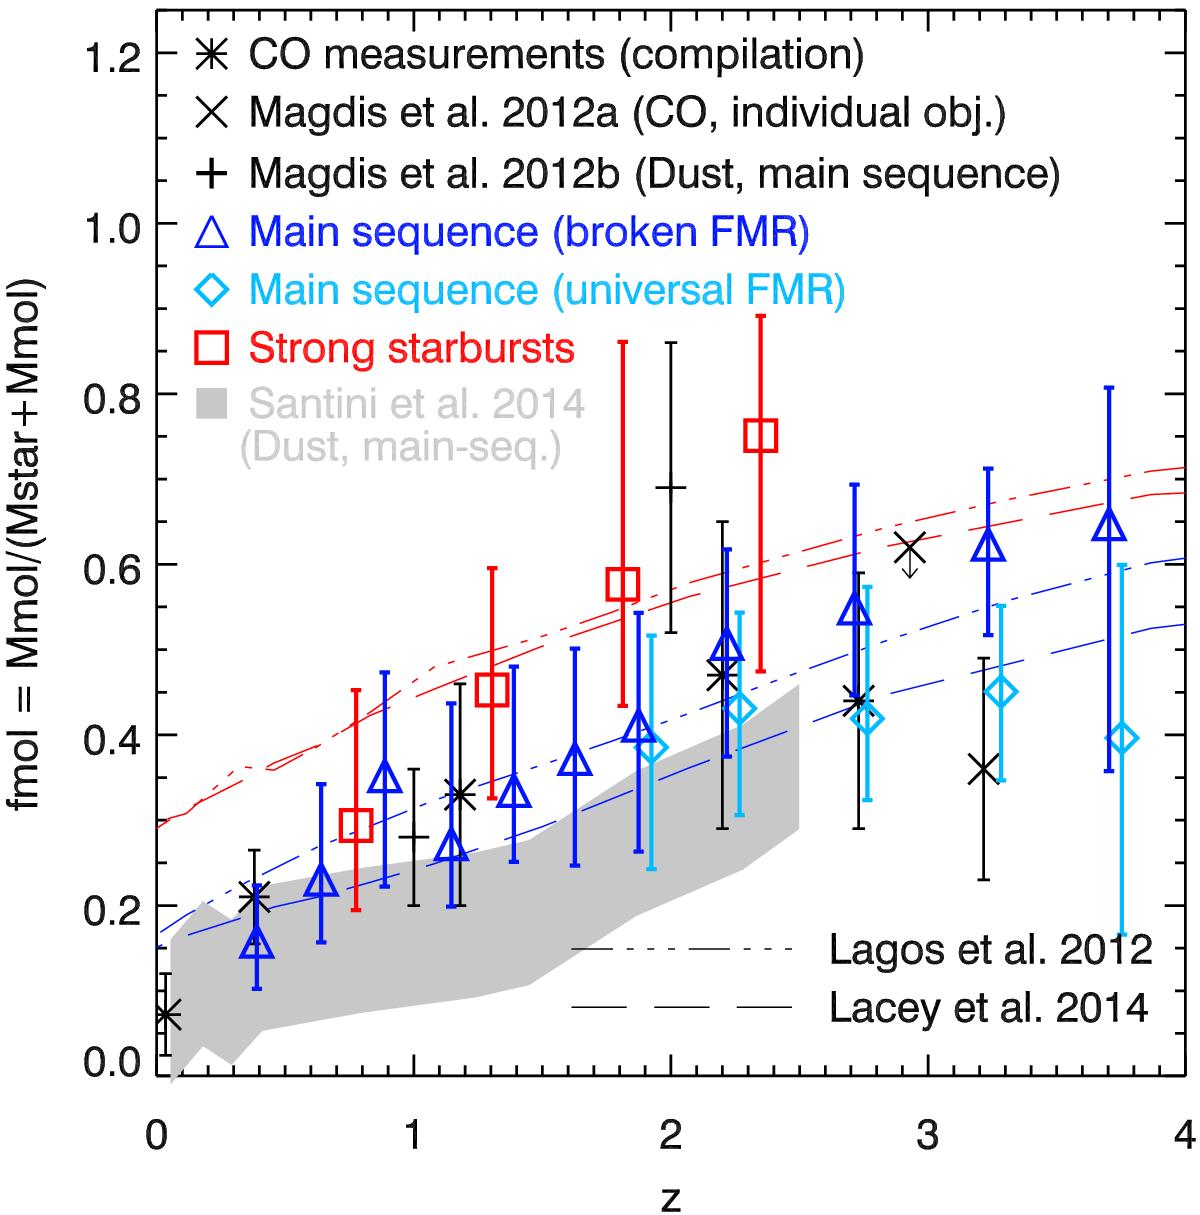
Evolution of the mean molecular gas fraction in massive galaxies (>3 × 10¹⁰M⊙). The starbursts are represented by red squares and the main-sequence galaxies by blue triangles or light blue diamonds depending on wether the gas fraction is estimated using a broken or an universal FMR, respectively. These results are compared with previous estimate using dust masses of Magdis et al. (2012a, black plus) and Santini et al. (2014, gray area), using CO for two z> 3 galaxies (Magdis et al. 2012b, black crosses), and the compilation of CO measurements of Saintonge et al. (2013, black asterisks). The predictions of the models of Lagos et al. (2012) and Lacey et al. (in prep.) for the same mass cut are overplotted with a three-dot-dash line and a long-dash line, respectively.
Current usage metrics show cumulative count of Article Views (full-text article views including HTML views, PDF and ePub downloads, according to the available data) and Abstracts Views on Vision4Press platform.
Data correspond to usage on the plateform after 2015. The current usage metrics is available 48-96 hours after online publication and is updated daily on week days.
Initial download of the metrics may take a while.