Fig. 8
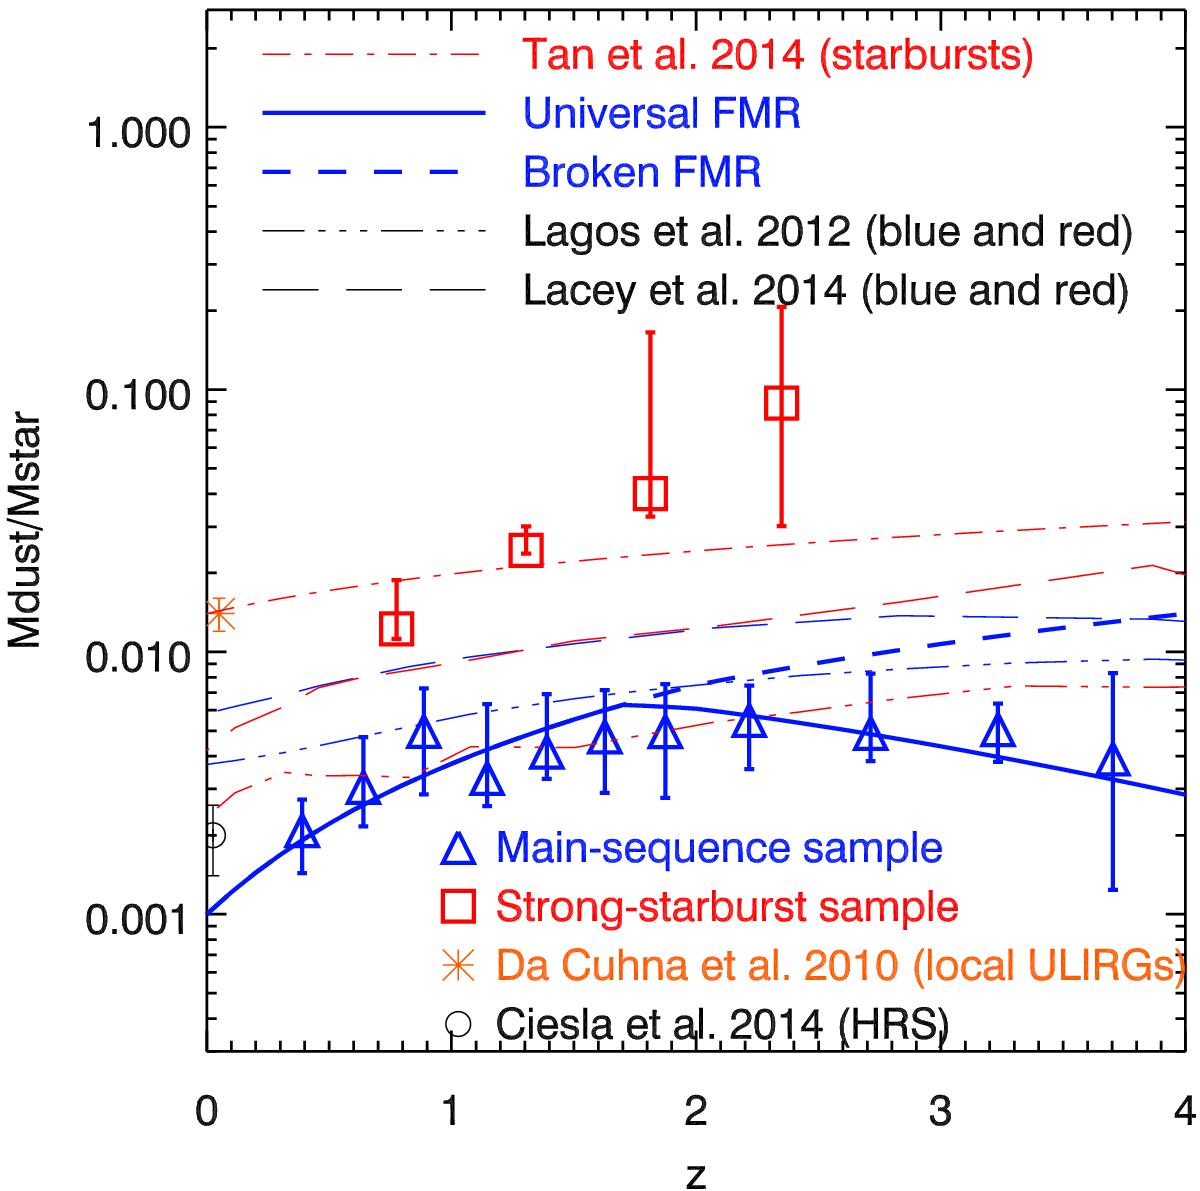
Mean ratio between dust and stellar mass as a function of redshift in main-sequence galaxies (blue triangles) and strong starbursts (red squares). The orange asterisk is the mean value found for the local ULIRG sample of da Cunha et al. (2008; see Magdis et al. 2012a). The black circle is the average value in HRS galaxies (Ciesla et al. 2014). The solid and dashed lines represent the evolutionary trends expected for a broken and universal FMR, respectively (see Sect. 4.3). The red dot-dashed line is the best-fit of the evolution found for a sample of individually-detected starbursts of Tan et al. (2014). The predictions of the models of Lagos et al. (2012) and Lacey et al. (in prep.) after applying the same mass cut and sSFR selection are overplotted with a three-dot-dash line and a long-dash line, respectively, with the same color code as the symbols.
Current usage metrics show cumulative count of Article Views (full-text article views including HTML views, PDF and ePub downloads, according to the available data) and Abstracts Views on Vision4Press platform.
Data correspond to usage on the plateform after 2015. The current usage metrics is available 48-96 hours after online publication and is updated daily on week days.
Initial download of the metrics may take a while.