Fig. 7
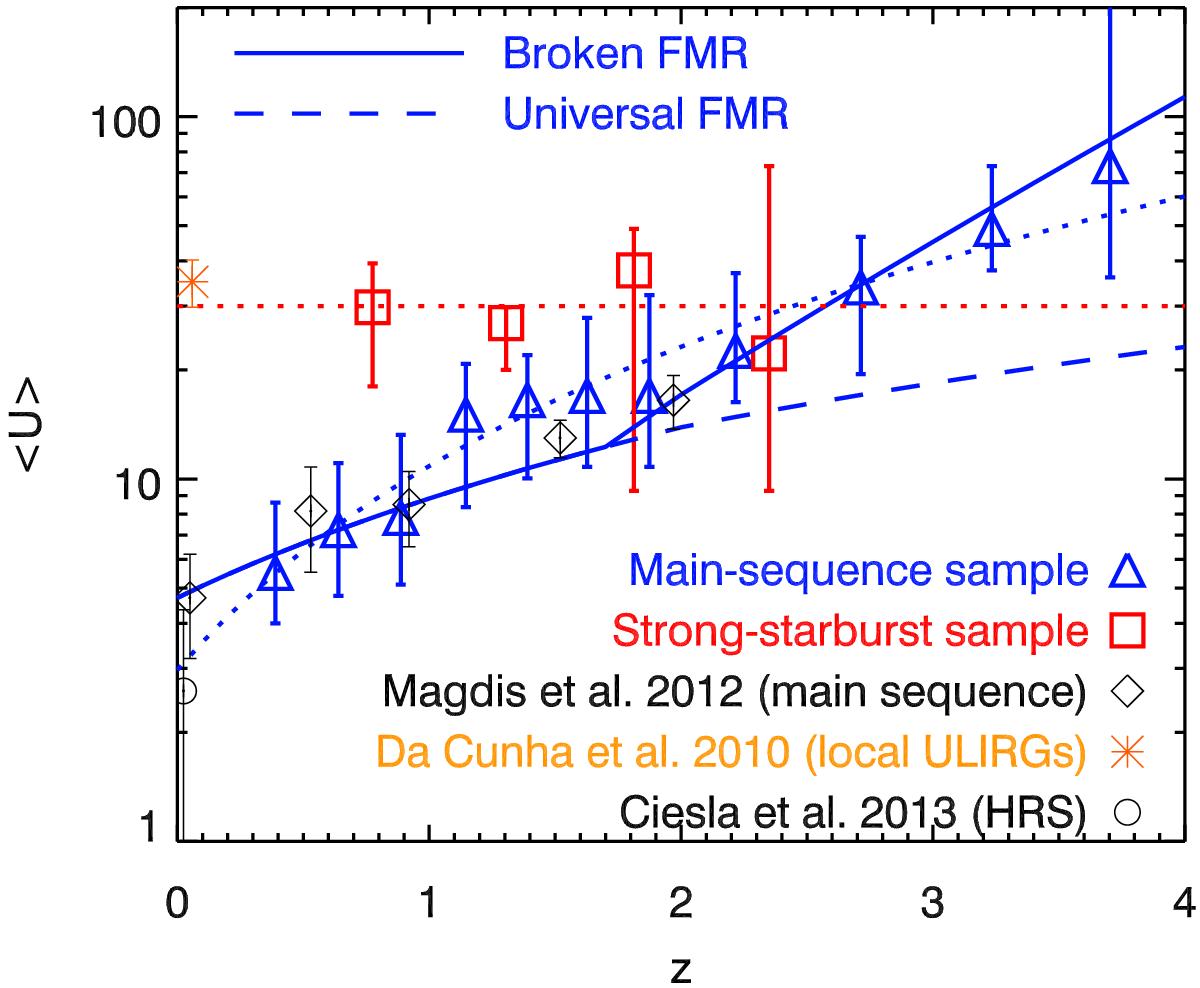
Evolution of the mean intensity of the radiation field ⟨ U ⟩ in main-sequence galaxies (blue triangles) and strong starbursts (red squares). The black diamonds are the measurements presented in Magdis et al. (2012a) based on a similar analysis but in the GOODS fields. The orange asterisk is the mean value found for the local ULIRG sample of da Cunha et al. (2008; see also Magdis et al. 2012a). The black circle is the average value in HRS galaxies (Ciesla et al. 2014). The solid and dashed lines represent the evolutionary trends expected for a broken and universal FMR, respectively (see Sect. 4.3). The blue dotted line is the best fit of the evolution of the main-sequence galaxies ((3.0 ± 1.1) × (1 + z)1.8 ± 0.4) and the red dotter line the best fit of the strong starburst data by a constant (31 ± 3).
Current usage metrics show cumulative count of Article Views (full-text article views including HTML views, PDF and ePub downloads, according to the available data) and Abstracts Views on Vision4Press platform.
Data correspond to usage on the plateform after 2015. The current usage metrics is available 48-96 hours after online publication and is updated daily on week days.
Initial download of the metrics may take a while.