Fig. 5
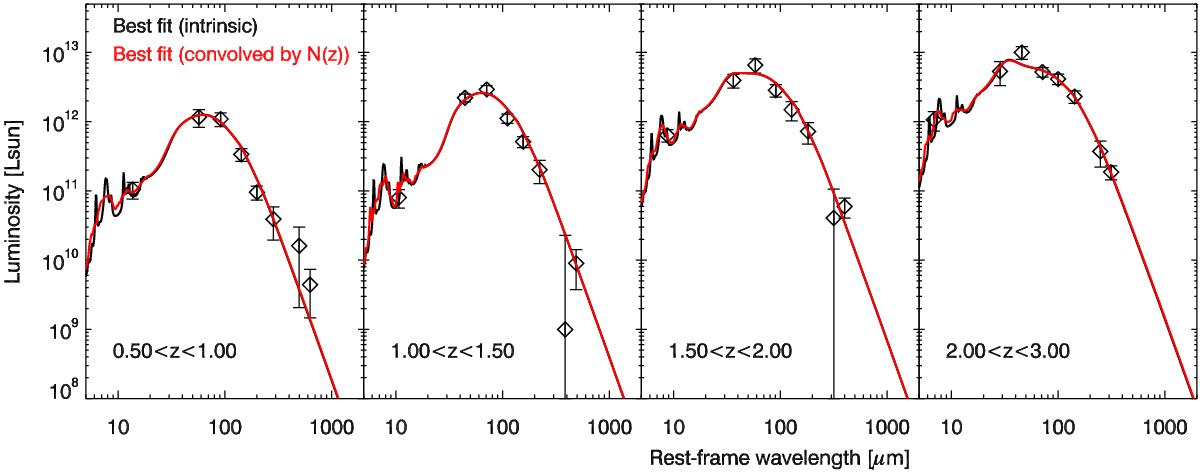
Rest-frame mean spectral energy distribution of our selection of strong starbursts at various redshift measured by stacking analysis. The data points are fitted using the Draine & Li (2007) model. This model is convolved with the redshift distribution of the sources before being compared to the data. The black and red lines show the intrinsic and convolved SEDs, respectively.
Current usage metrics show cumulative count of Article Views (full-text article views including HTML views, PDF and ePub downloads, according to the available data) and Abstracts Views on Vision4Press platform.
Data correspond to usage on the plateform after 2015. The current usage metrics is available 48-96 hours after online publication and is updated daily on week days.
Initial download of the metrics may take a while.