Fig. A.1
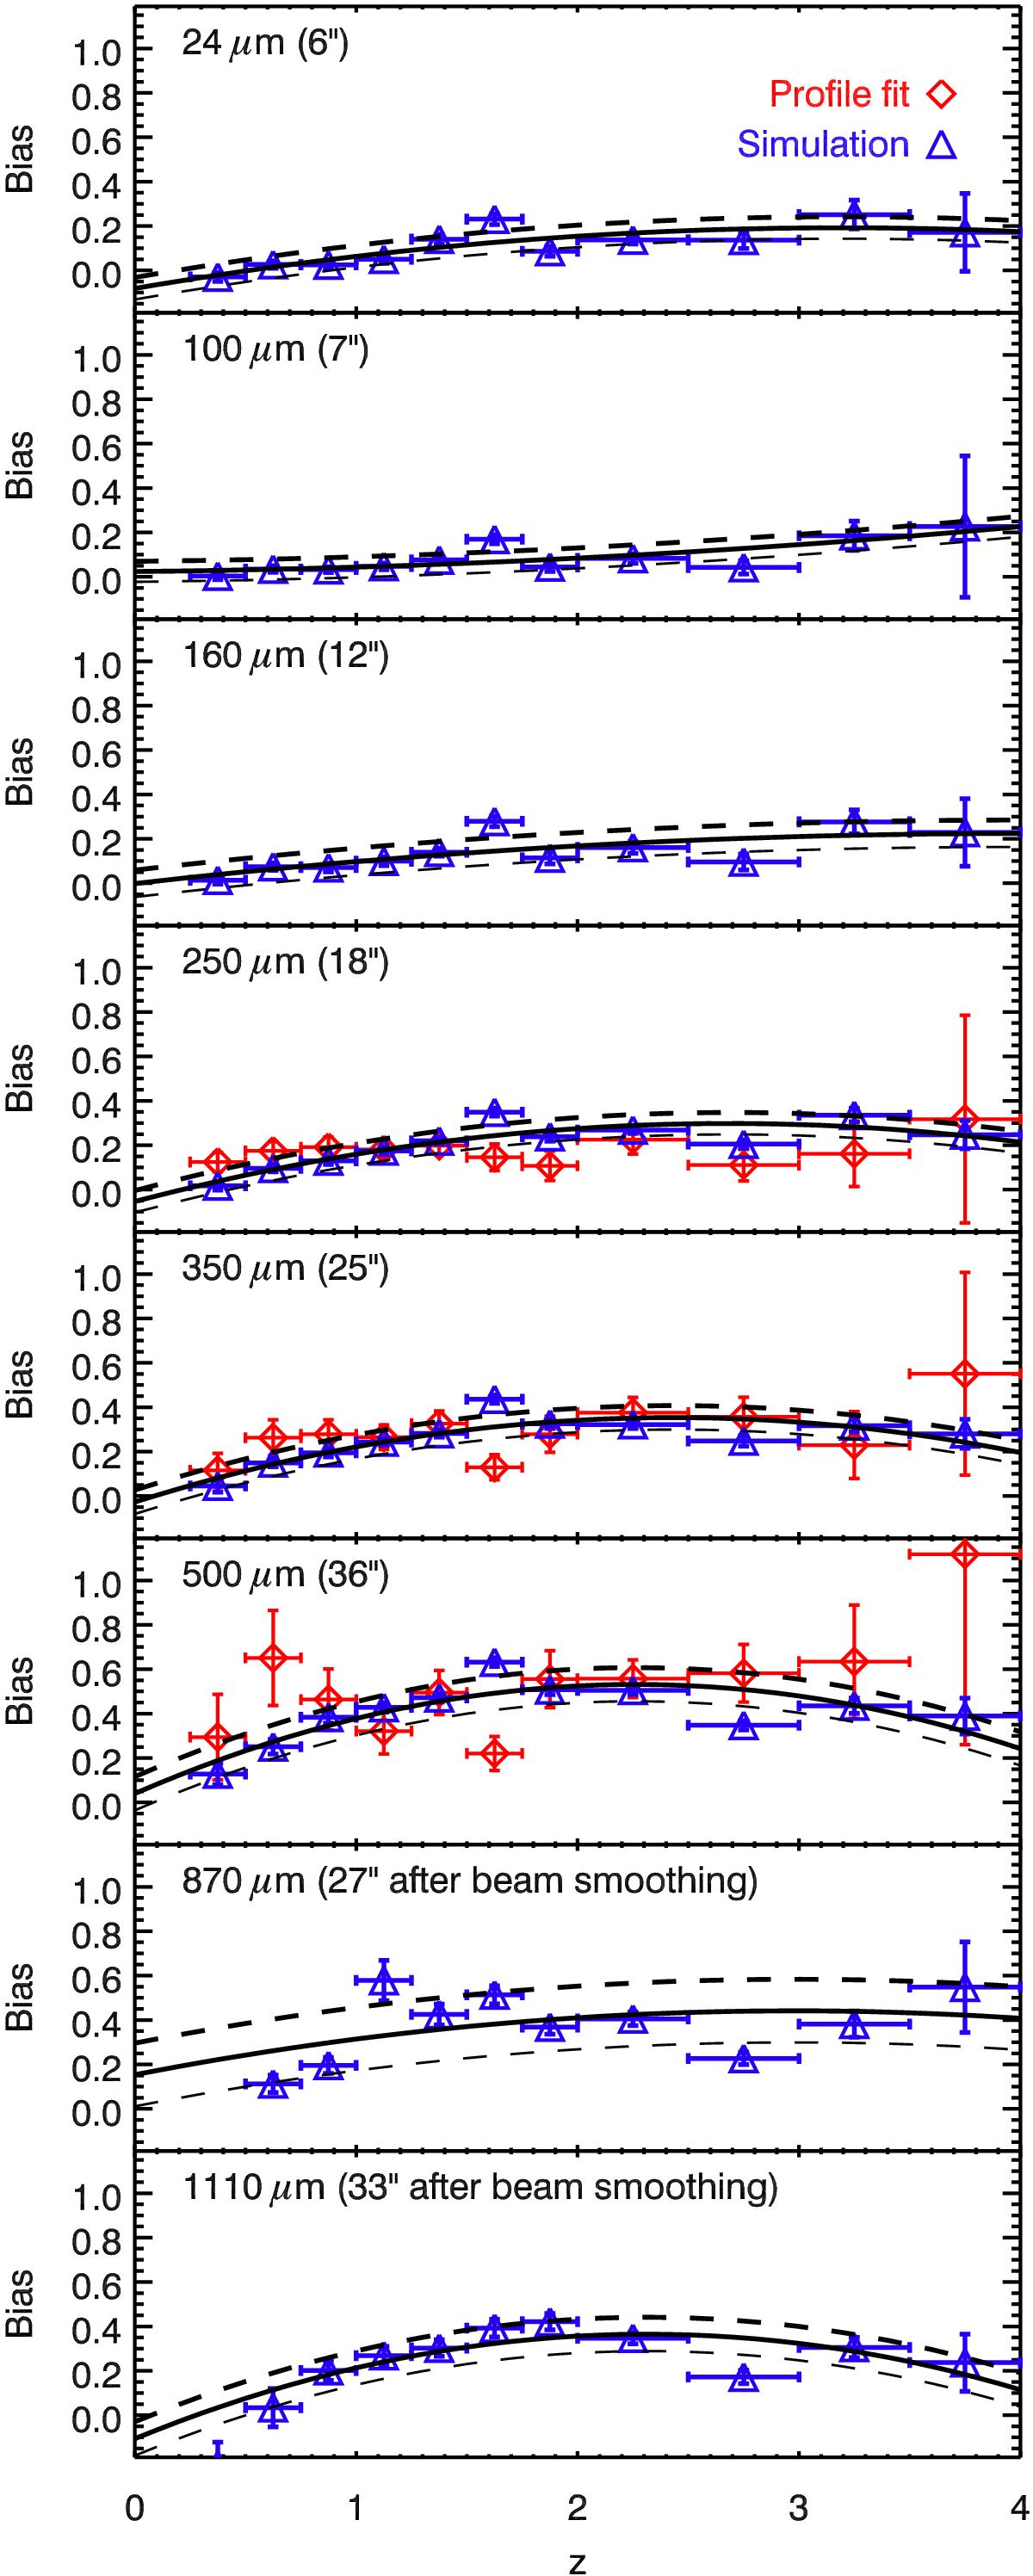
Relative bias induced by the clustering as a function of redshift at the various wavelengths we used in our analysis. The FWHM of the beam is provided in brackets. The blue triangles are the estimations from the simulation (Sect. A.1) and the red diamonds are provided by the fit of the clustering component in map space (Sect. A.2). These numbers are only valid for a complete sample of M⋆> 3 × 10¹⁰M⊙ galaxies.
Current usage metrics show cumulative count of Article Views (full-text article views including HTML views, PDF and ePub downloads, according to the available data) and Abstracts Views on Vision4Press platform.
Data correspond to usage on the plateform after 2015. The current usage metrics is available 48-96 hours after online publication and is updated daily on week days.
Initial download of the metrics may take a while.