Fig. 11
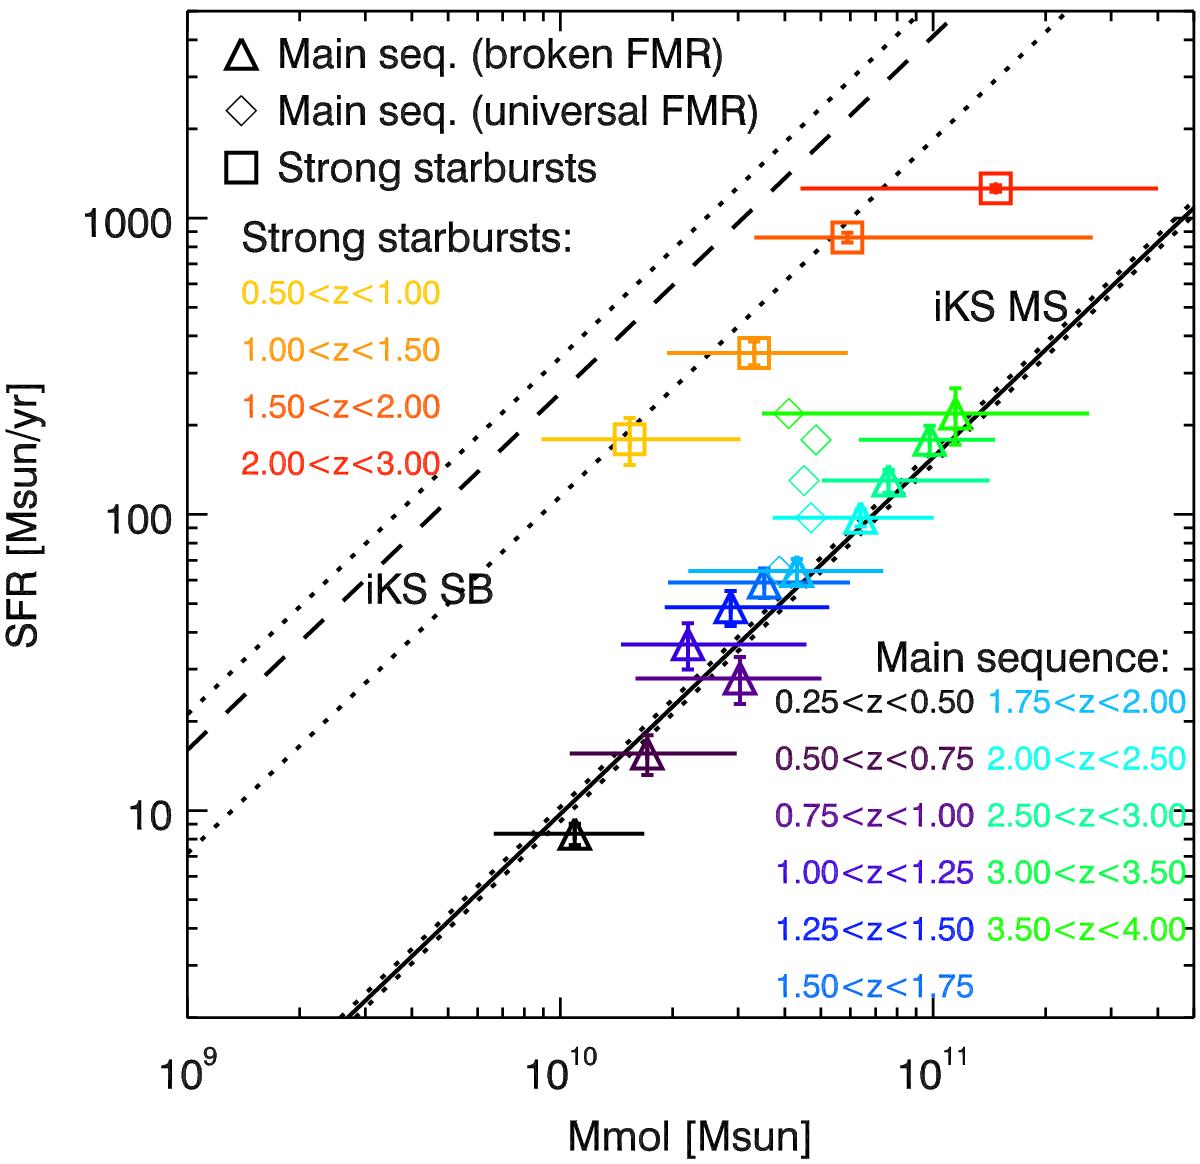
Relation between the mean SFR rate and the mean molecular gas mass in our galaxy samples, i.e., integrated Kennicutt-Schmidt law. The solid line and the dashed line are the center of the relation fitted by Sargent et al. (2014) on a compilation of data for main-sequence galaxies and starbursts, respectively. The dotted lines represent the 1σ uncertainties on these relations. The triangles and diamonds represent the average position of massive, main-sequence galaxies in this diagram assuming a broken FMR and an universal FMR, respectively. The squares indicates the average position of strong starbursts.
Current usage metrics show cumulative count of Article Views (full-text article views including HTML views, PDF and ePub downloads, according to the available data) and Abstracts Views on Vision4Press platform.
Data correspond to usage on the plateform after 2015. The current usage metrics is available 48-96 hours after online publication and is updated daily on week days.
Initial download of the metrics may take a while.