Fig. 1
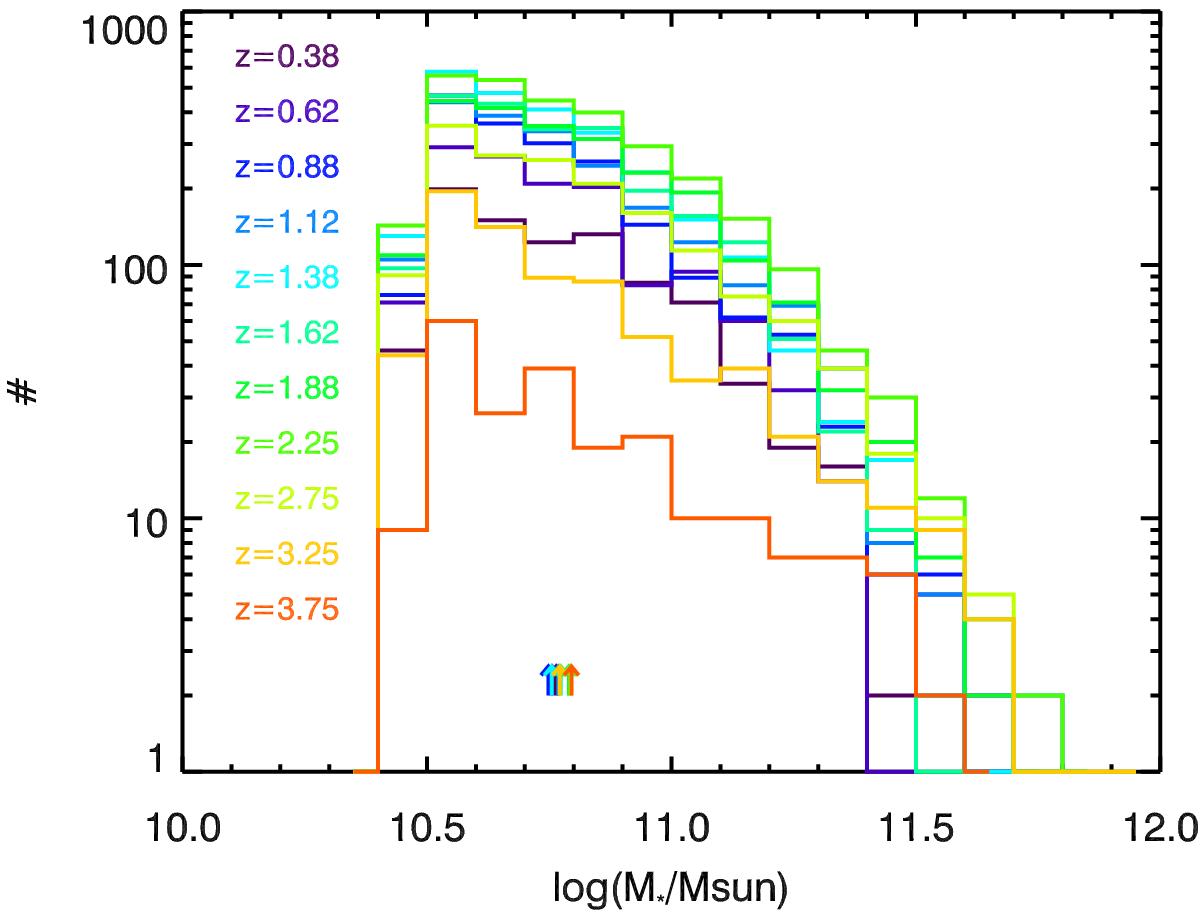
Stellar mass distribution of our samples of star-forming galaxies in the various redshift bins we used. Only galaxies more massive than our cut of 3 × 10¹⁰M⊙ are represented. The first bin contain fewer objects than the second one because our cut fall at the middle of the first one. The arrows indicate the mean stellar mass in each redshift bin.
Current usage metrics show cumulative count of Article Views (full-text article views including HTML views, PDF and ePub downloads, according to the available data) and Abstracts Views on Vision4Press platform.
Data correspond to usage on the plateform after 2015. The current usage metrics is available 48-96 hours after online publication and is updated daily on week days.
Initial download of the metrics may take a while.