Fig. 3
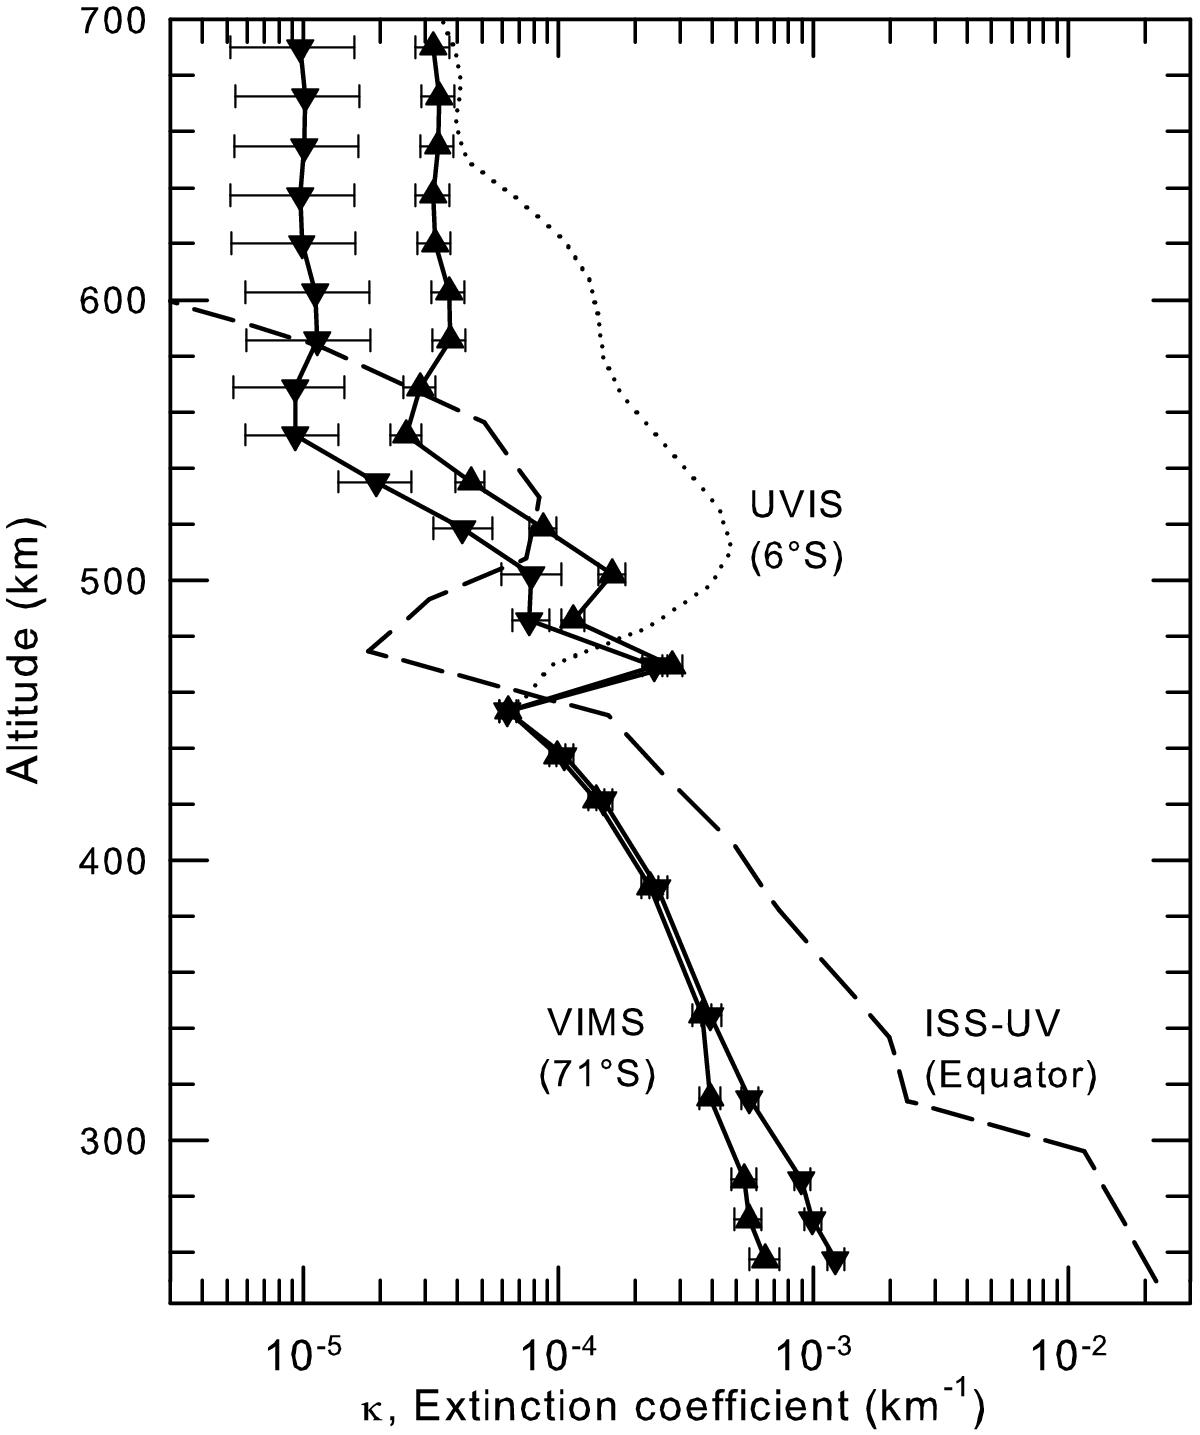
Variation between 250 and 700 km of the haze extinction coefficients at 3.33 μm (solid line with upward triangles for the aromatic component) and 3.38 μm (solid line with downward triangles for the aliphatic component). The extinction coefficient profiles inferred by West et al. (2011) from ISS/UV imaging (dashed line) and by Koskinen et al. (2011) from UVIS stellar occultation measurements (dotted line) are also represented. The local maxima around 500 km correspond to the detached haze layer.
Current usage metrics show cumulative count of Article Views (full-text article views including HTML views, PDF and ePub downloads, according to the available data) and Abstracts Views on Vision4Press platform.
Data correspond to usage on the plateform after 2015. The current usage metrics is available 48-96 hours after online publication and is updated daily on week days.
Initial download of the metrics may take a while.