Fig. 5
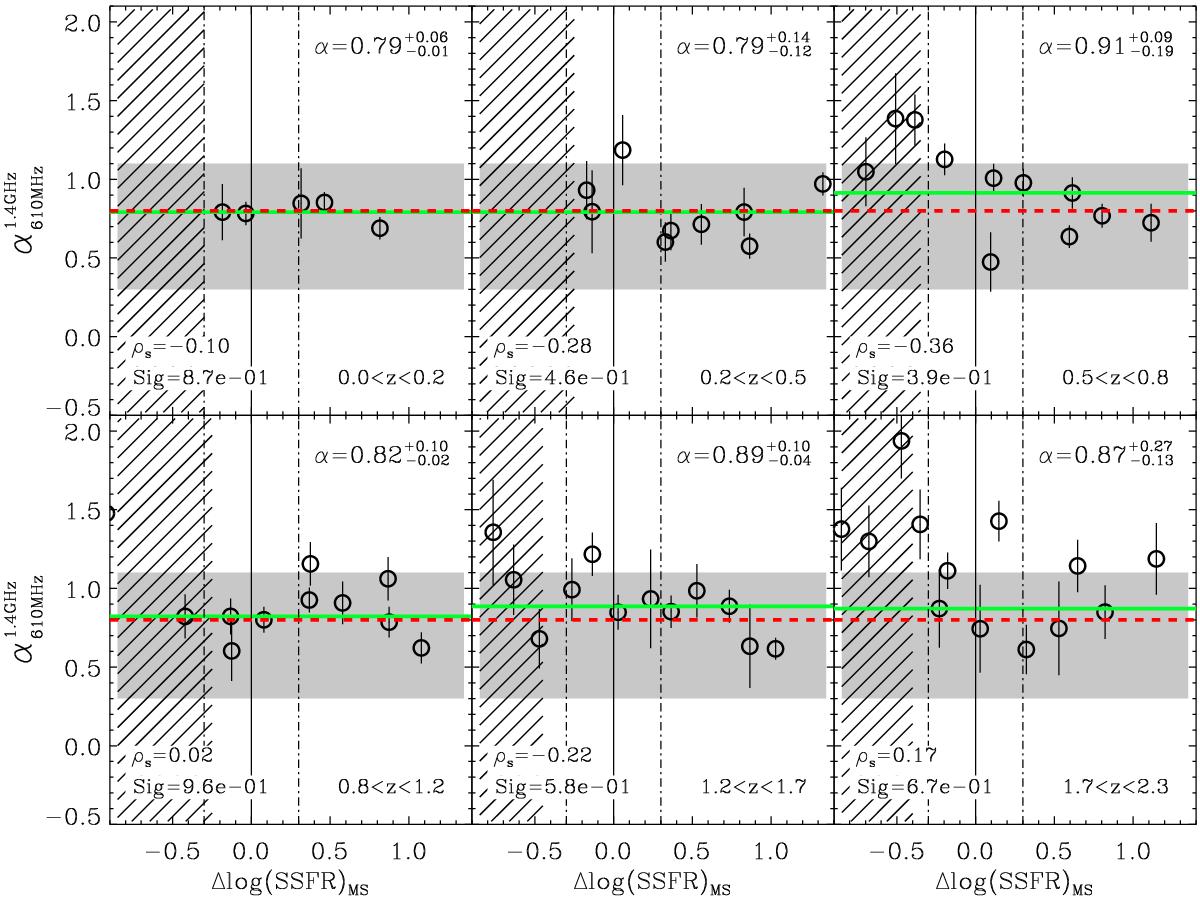
Radio spectral index (i.e. ![]() ) of galaxies as a function of
Δlog (SSFR)MS, as derived from our
stacking analysis. Hatched areas represent the regions of parameter space affected
by incompleteness (see text and Fig. 3). In
each panel, we give the median value (see also the green lines), the Spearman rank
correlation (ρs) and the null hypothesis
probability (Sig.) derived from data points in the region of parameter space not
affected by incompleteness. Red dashed lines correspond to the canonical
radio spectral index of 0.8 observed in local star-forming galaxies (Condon 1992) and high-redshift SMGs (Ibar et al. 2010). Shaded regions show the range
of
) of galaxies as a function of
Δlog (SSFR)MS, as derived from our
stacking analysis. Hatched areas represent the regions of parameter space affected
by incompleteness (see text and Fig. 3). In
each panel, we give the median value (see also the green lines), the Spearman rank
correlation (ρs) and the null hypothesis
probability (Sig.) derived from data points in the region of parameter space not
affected by incompleteness. Red dashed lines correspond to the canonical
radio spectral index of 0.8 observed in local star-forming galaxies (Condon 1992) and high-redshift SMGs (Ibar et al. 2010). Shaded regions show the range
of ![]() values (i.e. 0.7 ± 0.4) observed by Ibar et al. (2009) in a population of sub-mJy
radio galaxies. Vertical solid and dot-dashed lines show the localisation and width
of the MS of star formation. In the range of redshift and Δlog (SSFR)MS probed here,
values (i.e. 0.7 ± 0.4) observed by Ibar et al. (2009) in a population of sub-mJy
radio galaxies. Vertical solid and dot-dashed lines show the localisation and width
of the MS of star formation. In the range of redshift and Δlog (SSFR)MS probed here,
![]() does not significantly deviate from
its canonical value, 0.8.
does not significantly deviate from
its canonical value, 0.8.
Current usage metrics show cumulative count of Article Views (full-text article views including HTML views, PDF and ePub downloads, according to the available data) and Abstracts Views on Vision4Press platform.
Data correspond to usage on the plateform after 2015. The current usage metrics is available 48-96 hours after online publication and is updated daily on week days.
Initial download of the metrics may take a while.