Fig. 5
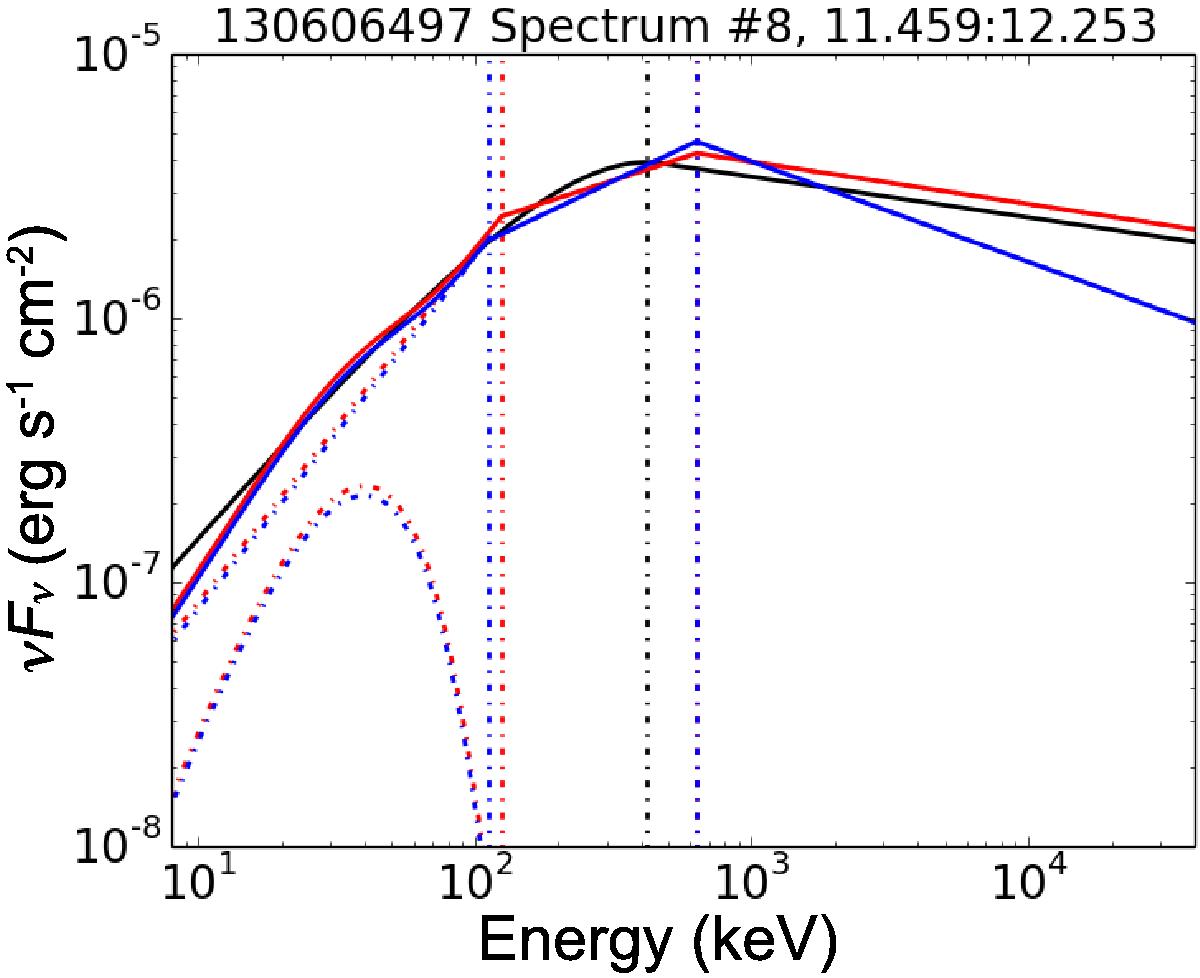
Selected spectrum from GRB 130606B plotted in νFν space. The black, red, and blue solid curve show the fitted spectrum for the Band, SYNC-slow+BB, and SYNC-fast+BB model, respectively, while the dash-dotted curves show individual SYNC or BB components. The vertical dash-dotted black, red, and blue line show the Ep and break energies for the Band, SYNC-slow+BB, and SYNC-fast+BB model, respectively.
Current usage metrics show cumulative count of Article Views (full-text article views including HTML views, PDF and ePub downloads, according to the available data) and Abstracts Views on Vision4Press platform.
Data correspond to usage on the plateform after 2015. The current usage metrics is available 48-96 hours after online publication and is updated daily on week days.
Initial download of the metrics may take a while.