Fig. 8
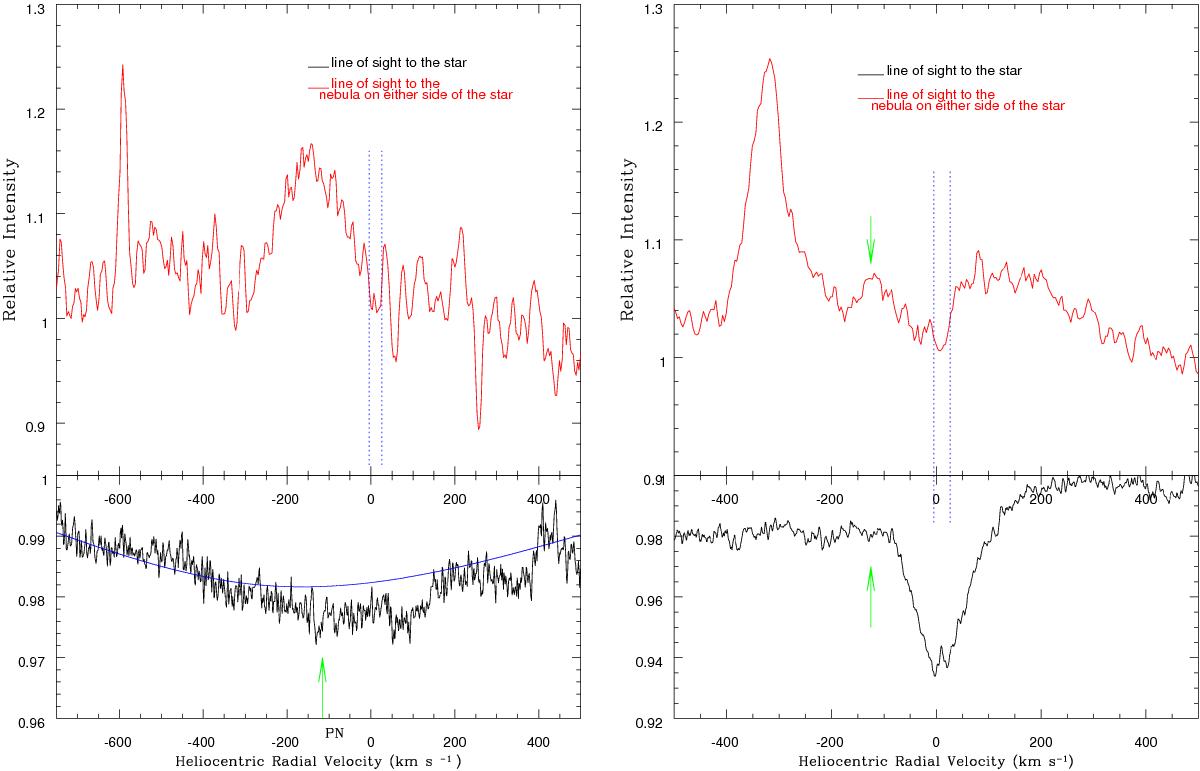
Profiles of the broad 4428 Å band (left panel) and of the 5780 Å feature (right panel) towards Tc 1 central star (black) and average of two sight lines to the nebular position on either side of the nebula (from Williams et al. 2008). In both panels, the dashed blue lines mark the interstellar components at −6.8 and +25 km s-1. Note the coincidence in velocity (marked by green arrows) of the profile centre of the broad 4428 and of the weak 5780 Å circumstellar absorptions and the corresponding nebular emissions. The emission feature to the left of the 5780 Å nebular emission is unidentified.
Current usage metrics show cumulative count of Article Views (full-text article views including HTML views, PDF and ePub downloads, according to the available data) and Abstracts Views on Vision4Press platform.
Data correspond to usage on the plateform after 2015. The current usage metrics is available 48-96 hours after online publication and is updated daily on week days.
Initial download of the metrics may take a while.