Fig. 6
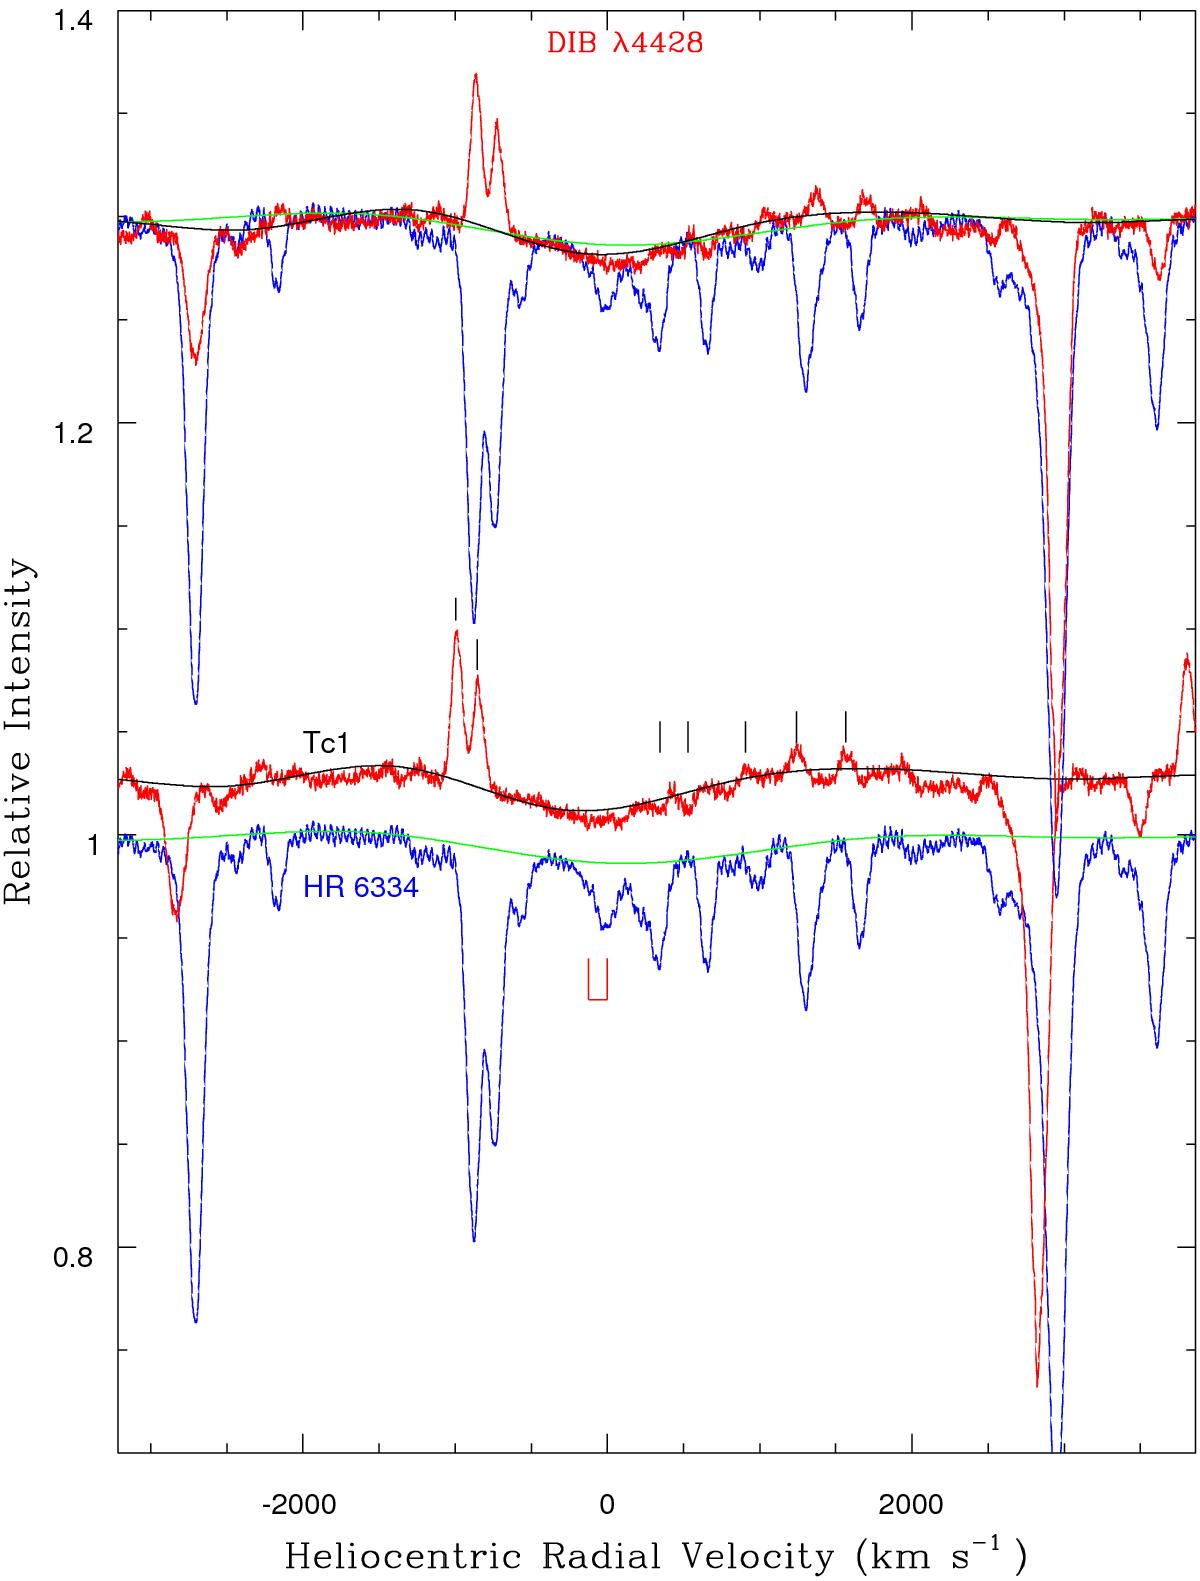
Profiles of the 4428 Å feature in Tc 1 (red) and in the comparison star HR 6334 (blue). The black and green profiles of the 4428 Å feature have been constructed by avoiding the stellar emission and absorption lines (marked by short black lines) and by fitting a high-degree polynomial function to the clearer regions. The minimum of the 4428 Å feature in HR 6334 occurs around 0.0 km s-1, while it seems to be blue-shifted in Tc 1. At the top, the profiles of Tc 1 has been shifted by 126 km s-1 redwards and superposed on the HR 6334 profile to illustrate the apparent non-coincidence of the minima of the profiles in both stars.
Current usage metrics show cumulative count of Article Views (full-text article views including HTML views, PDF and ePub downloads, according to the available data) and Abstracts Views on Vision4Press platform.
Data correspond to usage on the plateform after 2015. The current usage metrics is available 48-96 hours after online publication and is updated daily on week days.
Initial download of the metrics may take a while.