Fig. 9
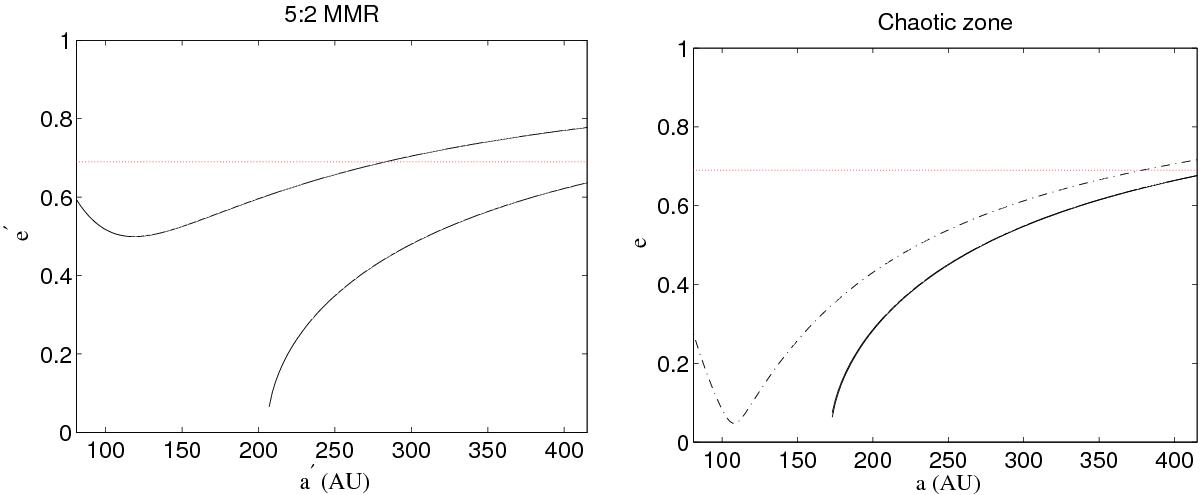
Theoretical eccentricities e′ adopted by test particles after a close encounter with Fom c, which has set them on an orbit with semi-major axis compatible with the orbit of Fom b. In the left panel, the 5:2 MMR will constrain the semi-major axis to aMMR and will allow a test particle to cross the chaotic zone of Fom c for values of eccentricity e between 0.2 and 0.8, hence the configurations (a′,e′) allowed for a particle after its encounter with Fom c are comprised between two curves. In the right panel, close-encounters occur in the chaotic zone of Fom c, with initially low-eccentricity particles (0 <e< 0.05), but here the semi-major axis can span values from the inner edge of the chaotic zone to the semi-major axis of Fom c. Therefore, there is a total of four curves on this plot, two curves for each boundary value in semi-major axis, but because of the small span in eccentricity, these are very close and appear as a single curve. The horizontal red dotted line figures the minimum eccentricity required for an orbit to be compatible with that of Fom b.
Current usage metrics show cumulative count of Article Views (full-text article views including HTML views, PDF and ePub downloads, according to the available data) and Abstracts Views on Vision4Press platform.
Data correspond to usage on the plateform after 2015. The current usage metrics is available 48-96 hours after online publication and is updated daily on week days.
Initial download of the metrics may take a while.