Fig. 7
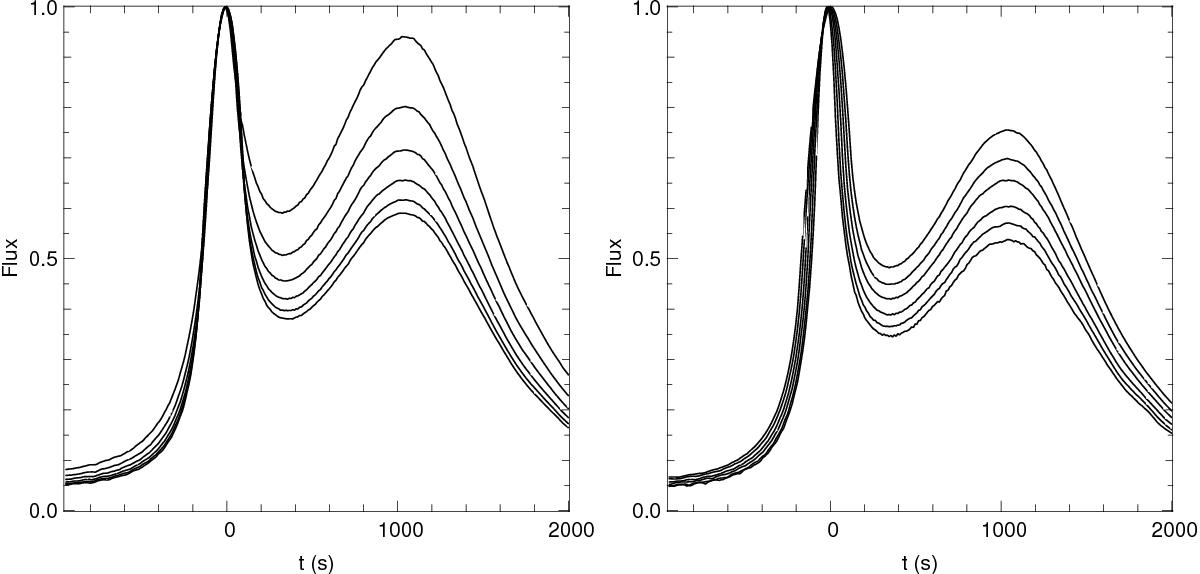
Normalized hotspot light curves obtained for an orbital radius equal to the value of the best fit. The flux is in arbitrary units. Left: hotspot radius equal to the best fit value. Inclination i varies over all grid values. (The range of these parameters are defined in Sect 5.2.3.) The closer the inclination to 90°, the higher the ratio between the two local maxima. Right: inclination fixed at its best fit value and R varies over all grid values. The smaller R, the bigger the ratio between the two subflare peaks. The time interval between the two local maxima is the same for all curves in these two figures.
Current usage metrics show cumulative count of Article Views (full-text article views including HTML views, PDF and ePub downloads, according to the available data) and Abstracts Views on Vision4Press platform.
Data correspond to usage on the plateform after 2015. The current usage metrics is available 48-96 hours after online publication and is updated daily on week days.
Initial download of the metrics may take a while.