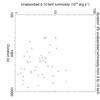
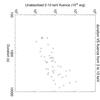
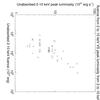
Fig. 6

2011 March 30 flare vs. the 2012 Chandra XVP campaign flares. The X-ray flares from the Chandra XVP campaign (Neilsen et al. 2013) are shown by crosses, the two brightest flares seen be XMM-Newton are triangles, the 2011 March 30 flare is represented by a diamond, and the two subflares are shown with squares.
This figure is made of several images, please see below:
Current usage metrics show cumulative count of Article Views (full-text article views including HTML views, PDF and ePub downloads, according to the available data) and Abstracts Views on Vision4Press platform.
Data correspond to usage on the plateform after 2015. The current usage metrics is available 48-96 hours after online publication and is updated daily on week days.
Initial download of the metrics may take a while.