Fig. 4
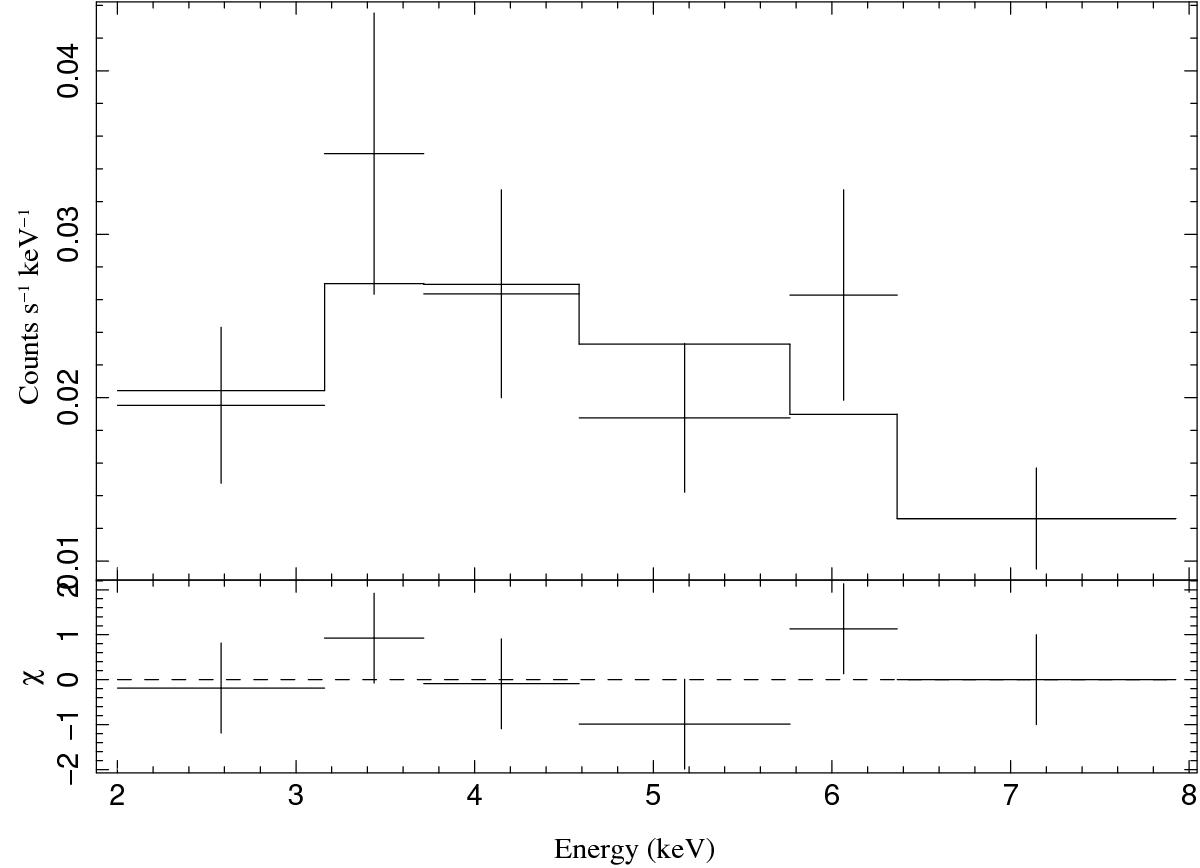
XMM-Newton/EPIC pn spectrum of the 2011 March 30 flare. The data are denoted by crosses. The vertical bars is the 1σ error in the count rate and horizontal bars show the spectral bin in energy. The events have been grouped with a minimum signal-to-noise ratio of 4. Top: the result of the fit is shown by the continuous solid line. Bottom: the χ2 residual in units of σ.
Current usage metrics show cumulative count of Article Views (full-text article views including HTML views, PDF and ePub downloads, according to the available data) and Abstracts Views on Vision4Press platform.
Data correspond to usage on the plateform after 2015. The current usage metrics is available 48-96 hours after online publication and is updated daily on week days.
Initial download of the metrics may take a while.