Fig. 3
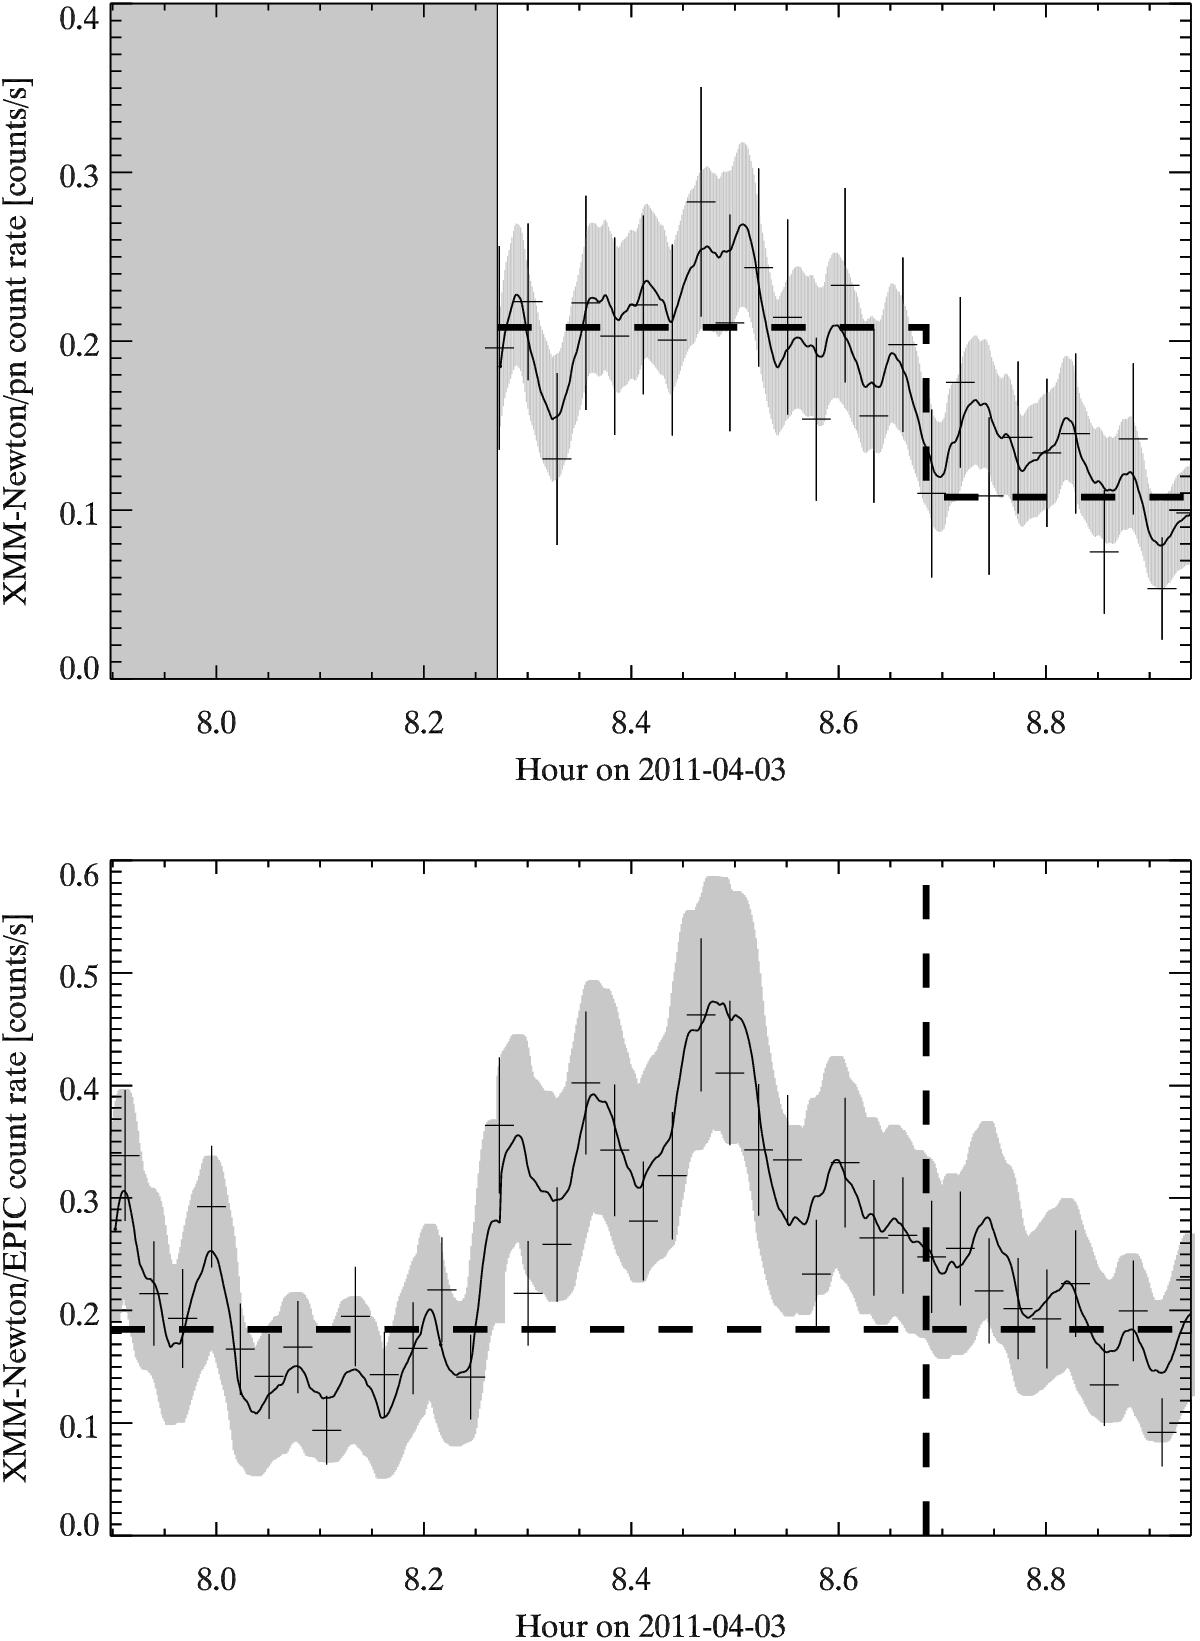
XMM-Newton light curve of the 2011 April 3 flare from Sgr A* in the 2−10 keV energy range. Top panel: the XMM-Newton/EPIC pn light curve binned on 100s. The crosses are the data points of the light curve. The horizontal dashed lines represent the non-flaring level found by the Bayesian-blocks algorithm. The vertical dashed lines show the start and stop of the Bayesian block. The solid line is the smoothed light curve. The gray curve are the errors associated with the smoothed light curve. The time period during which the camera did not observe is shown with a light gray box. Bottom panel: the XMM-Newton/EPIC (pn+MOS1+MOS2) light curve binned on 100 s. The horizontal dashed line represents the non-flaring level calculated as the sum of the non-flaring level in each instrument found by the Bayesian blocks. The vertical dashed lines represent the beginning and the end of the flare calculated by the Bayesian-blocks algorithm on pn camera. The solid line is the smoothed light curve, which is the sum of the smoothed light curve for each instrument (calculated on the same time range). The gray curve are the errors associated with the smoothed light curve.
Current usage metrics show cumulative count of Article Views (full-text article views including HTML views, PDF and ePub downloads, according to the available data) and Abstracts Views on Vision4Press platform.
Data correspond to usage on the plateform after 2015. The current usage metrics is available 48-96 hours after online publication and is updated daily on week days.
Initial download of the metrics may take a while.