Fig. 10
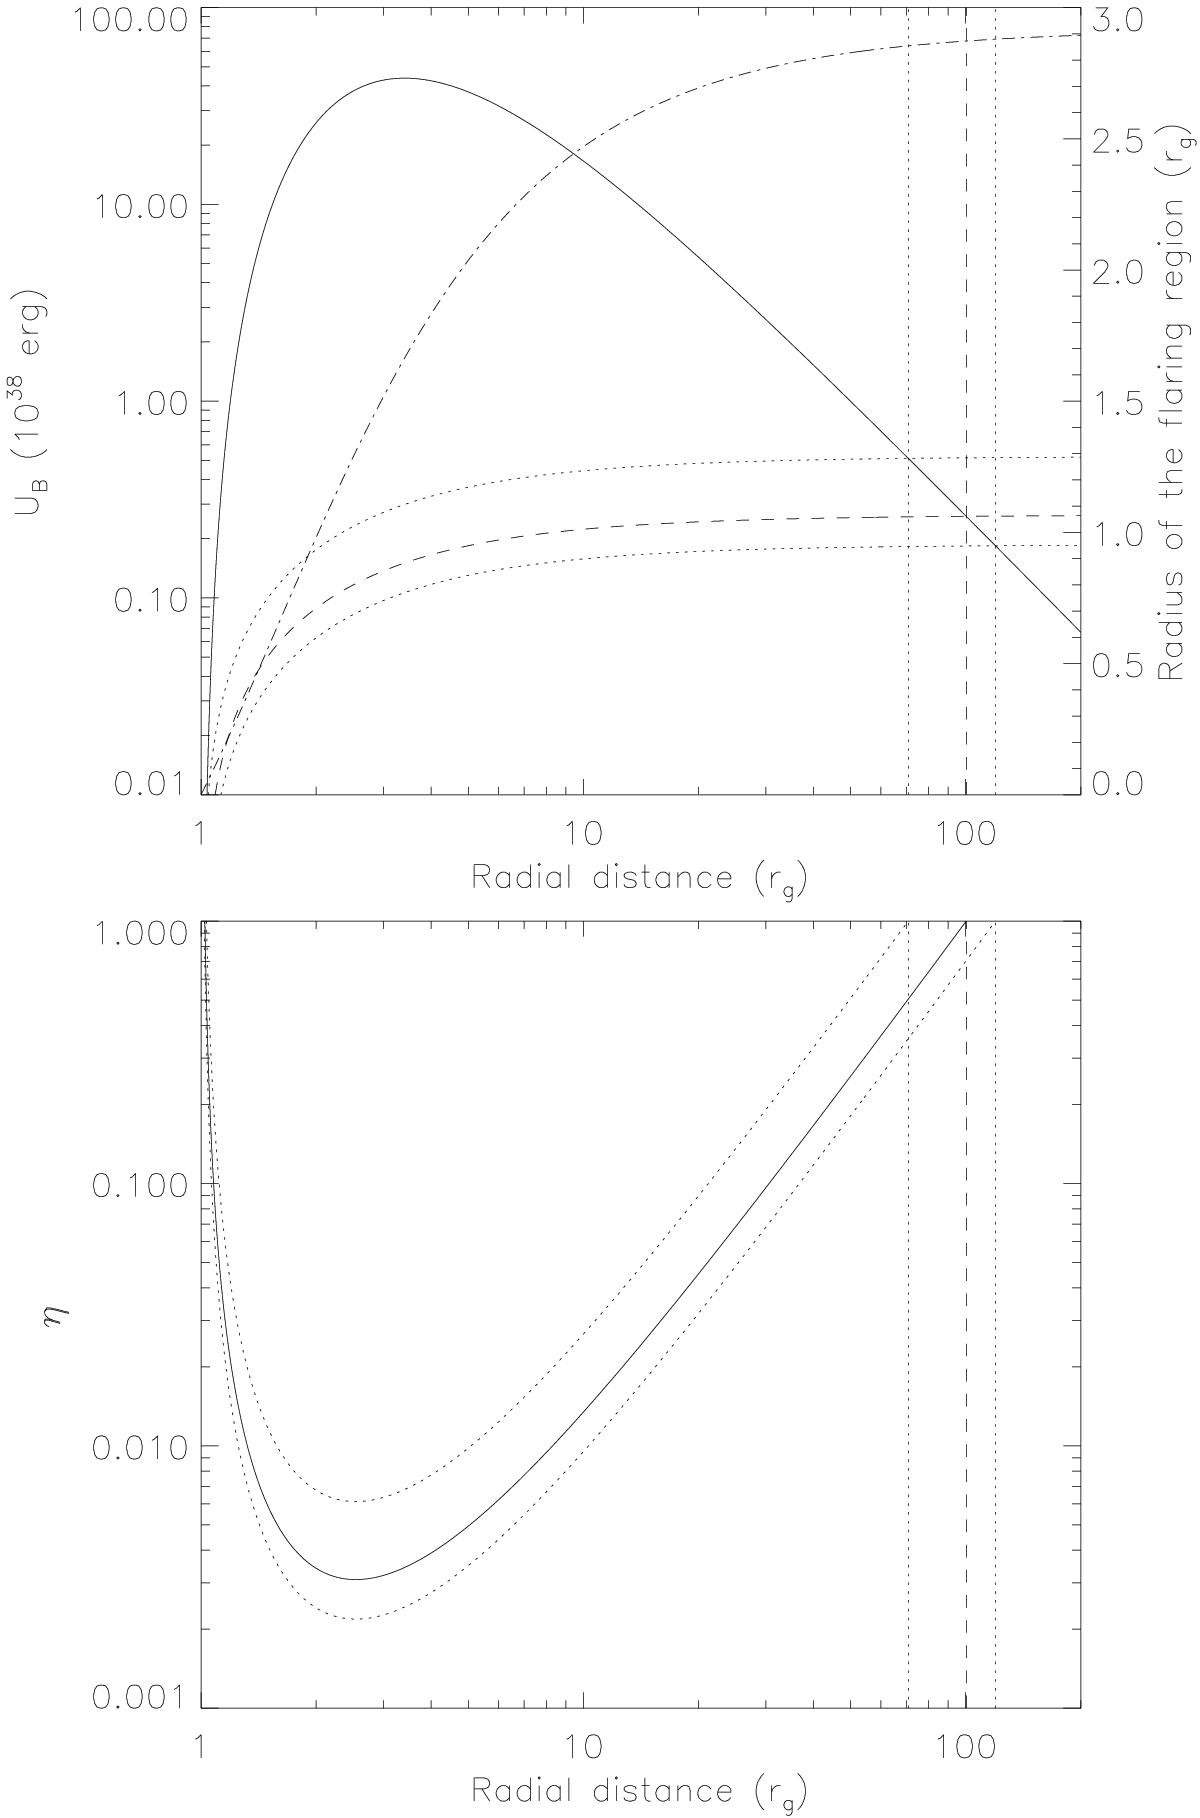
Determination of the radial distance of the flaring region. Top panel: magnetic energy vs. radial distance for a magnetic field of 100 G at 2 rg and an X-ray photon production efficiency and dimensionless spin parameter of 1. The solid line is the distribution of the magnetic energy (see left y-axis) vs. the radial distance. The dashed and dotted lines represent the central value of the X-ray fluence and its errors with 90% confidence level, respectively. The vertical lines are the corresponding upper limits to the distance. The dashed-dotted line represents the radius of the emitting region (see right y-axis). Bottom panel: X-ray photons production efficiency vs. radial distance for the fluence and its upper and lower limit. The solid and dotted lines represent the efficiency for the central value of the fluence and its errors within 90% confidence level, respectively.

Current usage metrics show cumulative count of Article Views (full-text article views including HTML views, PDF and ePub downloads, according to the available data) and Abstracts Views on Vision4Press platform.
Data correspond to usage on the plateform after 2015. The current usage metrics is available 48-96 hours after online publication and is updated daily on week days.
Initial download of the metrics may take a while.