Fig. 1
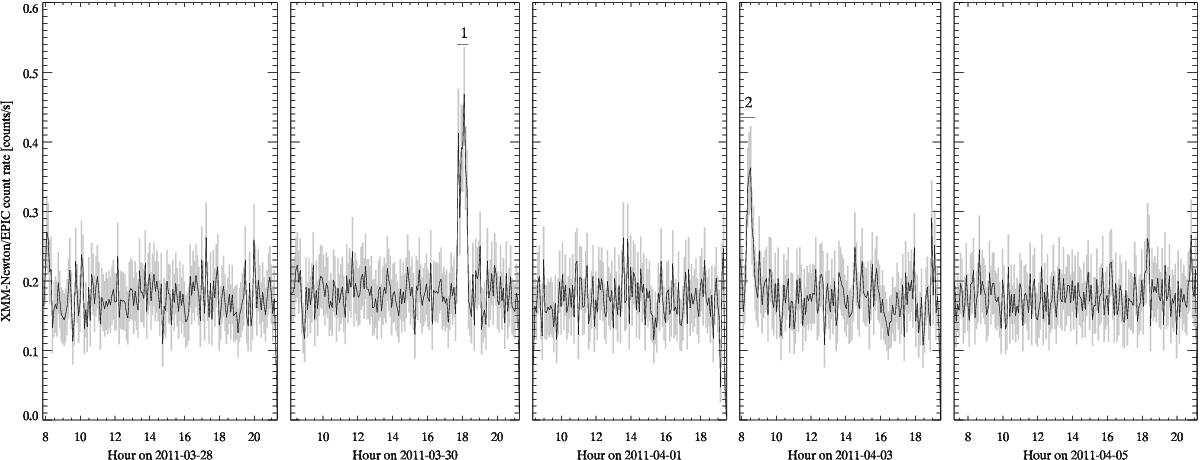
XMM-Newton/EPIC (pn+MOS1+MOS2) light curves of Sgr A* in the 2−10 keV energy range obtained in Spring 2011. The time interval used to bin the light curve is 300 s. The X-ray flares are labeled from 1 to 2. The horizontal lines below these labels indicate the flare durations. The non-flaring level of Sgr A* corresponds to only 10% of the non-flaring level of these light curves (Porquet et al. 2008).
Current usage metrics show cumulative count of Article Views (full-text article views including HTML views, PDF and ePub downloads, according to the available data) and Abstracts Views on Vision4Press platform.
Data correspond to usage on the plateform after 2015. The current usage metrics is available 48-96 hours after online publication and is updated daily on week days.
Initial download of the metrics may take a while.