Free Access
Fig. 9
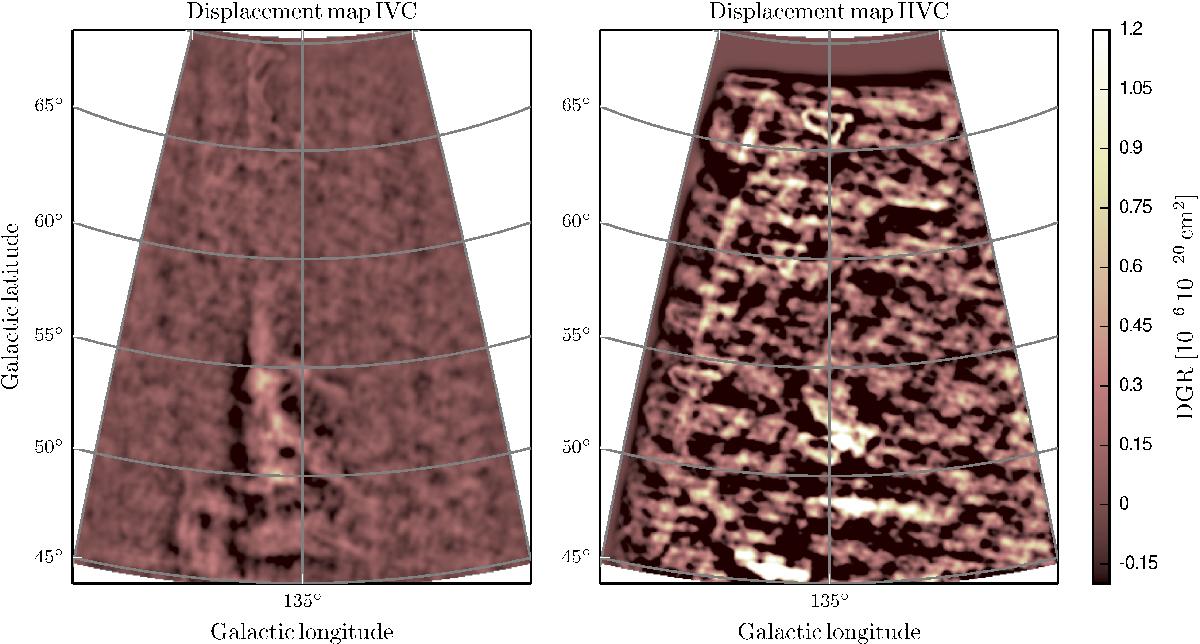
Application of the displacement-map technique (Peek et al. 2009). Left: normalised cross-correlation of IVC opacity and H i column density. The variations in this map allow us to measure the uncertainty of ϵIVC. Right: same image as left, but with the HVC displaced across the map.
Current usage metrics show cumulative count of Article Views (full-text article views including HTML views, PDF and ePub downloads, according to the available data) and Abstracts Views on Vision4Press platform.
Data correspond to usage on the plateform after 2015. The current usage metrics is available 48-96 hours after online publication and is updated daily on week days.
Initial download of the metrics may take a while.