Fig. 10
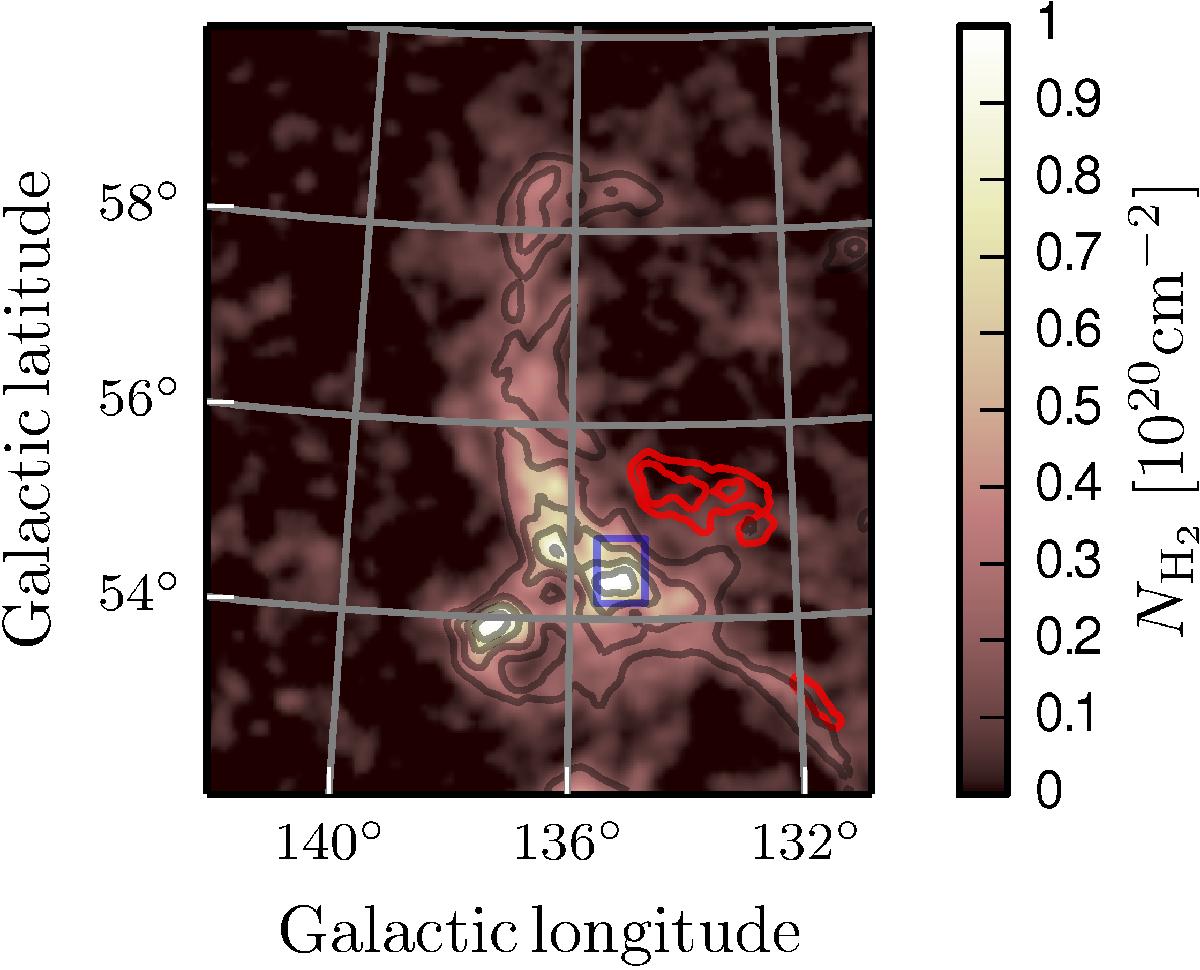
Distribution of the cold, dominantly molecular, gaseous phase of IVC135+54. Using Eq. (9), we convert the FIR excess emission (Figs. 7 and 8) into upper limits to the molecular column density. The blue rectangle indicates the region in which Weiß et al. (1999) have detected 12CO and 13CO. Superposed are the HVC contours, starting at 6 × 1019 cm-2 and increasing in steps of 2 × 1019 cm-2 (red) and the IVC contours starting at 1.1 × 1020 cm-2 and increasing in steps of 4 × 1019 cm-2 (black).
Current usage metrics show cumulative count of Article Views (full-text article views including HTML views, PDF and ePub downloads, according to the available data) and Abstracts Views on Vision4Press platform.
Data correspond to usage on the plateform after 2015. The current usage metrics is available 48-96 hours after online publication and is updated daily on week days.
Initial download of the metrics may take a while.