Free Access
Fig. 1
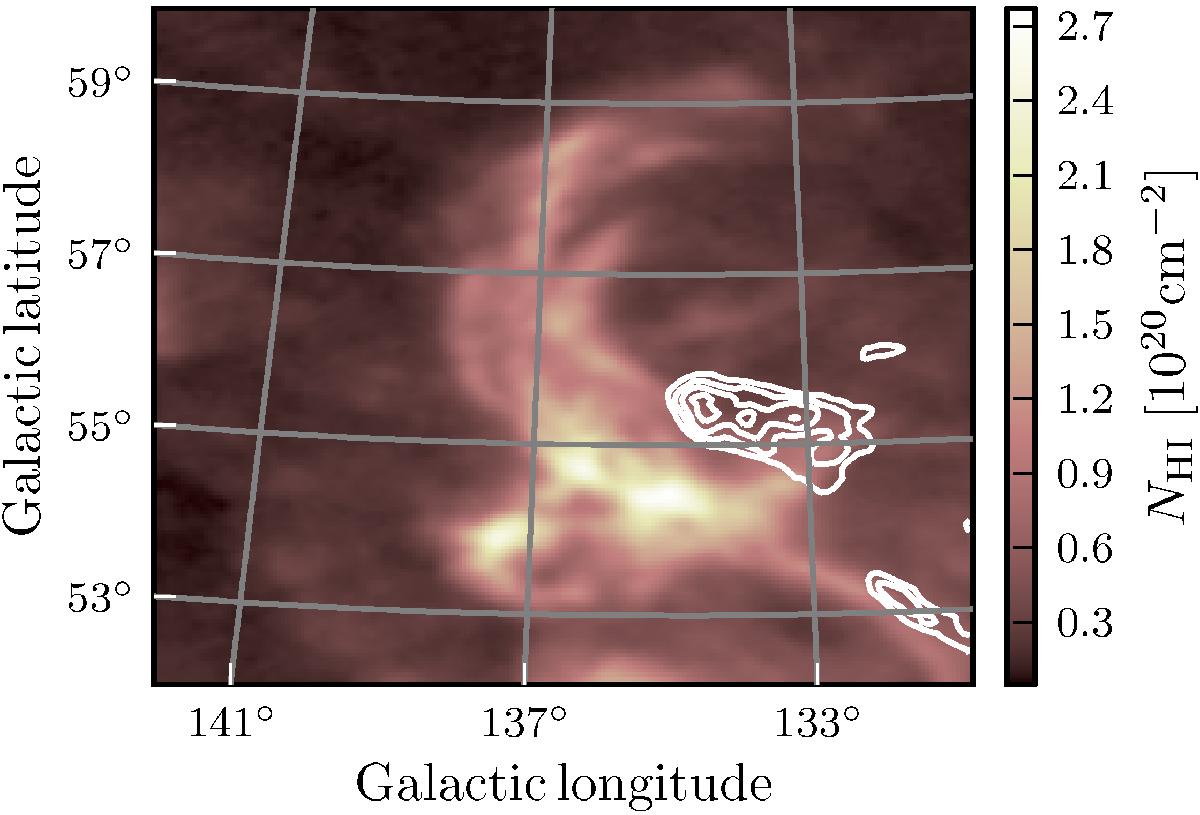
EBHIS (Kerp et al. 2011) column density map of IVC135+54 with the HVC contours superposed. For the IVC, velocities (−52 km s-1 ≤ vLSR ≤ −31 km s-1) are taken into account. For the HVC, we use (− 190 km s-1 ≤ vLSR ≤ −90 km s-1). Contours start at 6 × 1019 cm-2 and increase in steps of 2 × 1019 cm-2.
Current usage metrics show cumulative count of Article Views (full-text article views including HTML views, PDF and ePub downloads, according to the available data) and Abstracts Views on Vision4Press platform.
Data correspond to usage on the plateform after 2015. The current usage metrics is available 48-96 hours after online publication and is updated daily on week days.
Initial download of the metrics may take a while.