Fig. 9
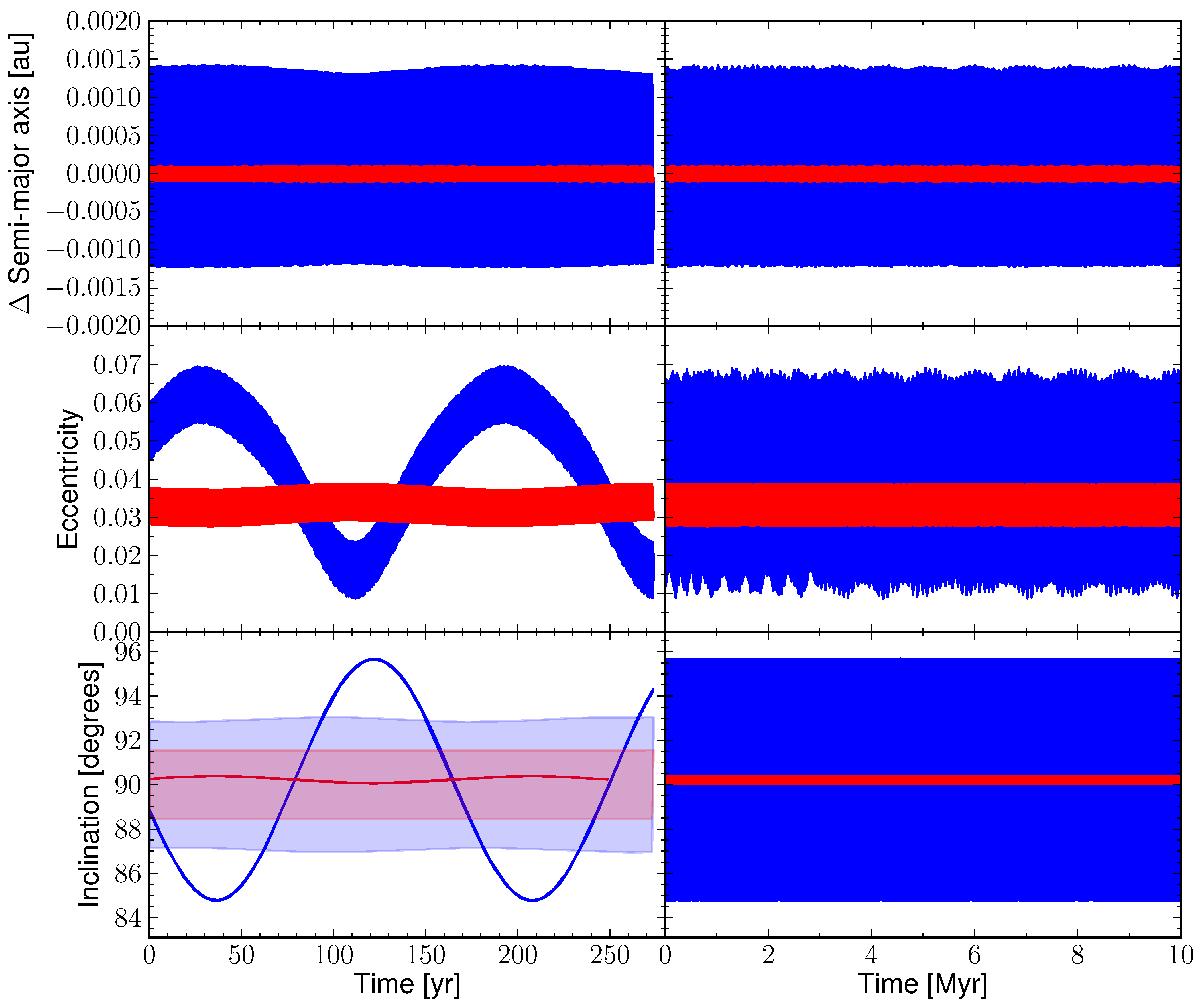
Evolution of semi-major axes (top), eccentricities (center), and orbital inclinations (bottom) over a 10 Myr simulation of the most probable solution. The respective mean has been subtracted from the two semi-major axes. On the left, a zoom on the first 300 yr; on the right, the variation intervals of the parameters. In blue planet b, in red planet c. The shaded regions in the left panel of the inclinations correspond to the values resulting in a transit (see Eq. (7) of Winn 2010).
Current usage metrics show cumulative count of Article Views (full-text article views including HTML views, PDF and ePub downloads, according to the available data) and Abstracts Views on Vision4Press platform.
Data correspond to usage on the plateform after 2015. The current usage metrics is available 48-96 hours after online publication and is updated daily on week days.
Initial download of the metrics may take a while.