Fig. 8
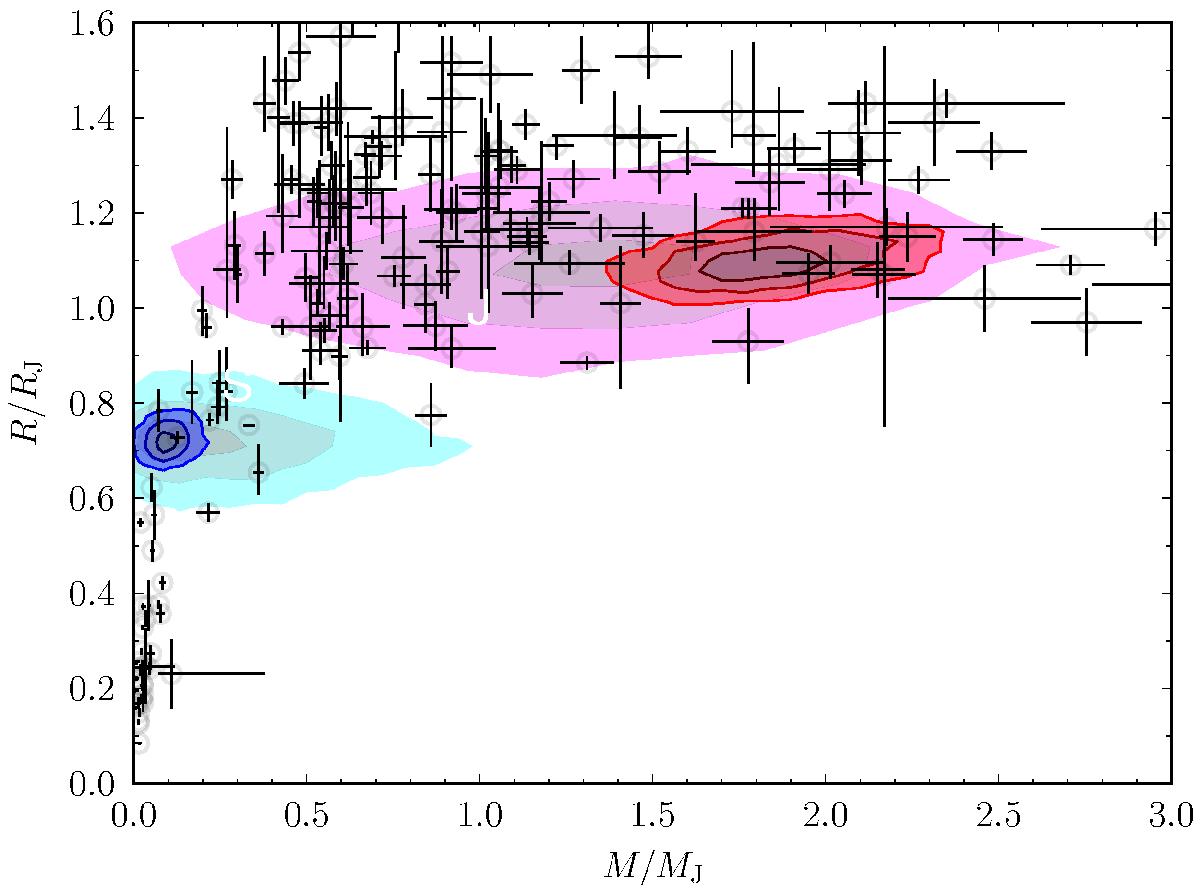
Mass-radius diagram for the solutions without (cyan for planet b, magenta for planet c) and with (blue for planet b, red for planet c) TTVs. The blue and red solutions are those indicated in Table 3. The colors, from the center to the edge of the regions, correspond to the 39.3%, 86.5%, and 98.9% joint confidence intervals. Jupiter and Saturn (labeled J and S) are marked for comparison. The other planet parameters were taken from Wright et al. (2011).
Current usage metrics show cumulative count of Article Views (full-text article views including HTML views, PDF and ePub downloads, according to the available data) and Abstracts Views on Vision4Press platform.
Data correspond to usage on the plateform after 2015. The current usage metrics is available 48-96 hours after online publication and is updated daily on week days.
Initial download of the metrics may take a while.