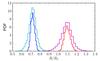
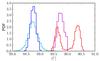
Fig. 7
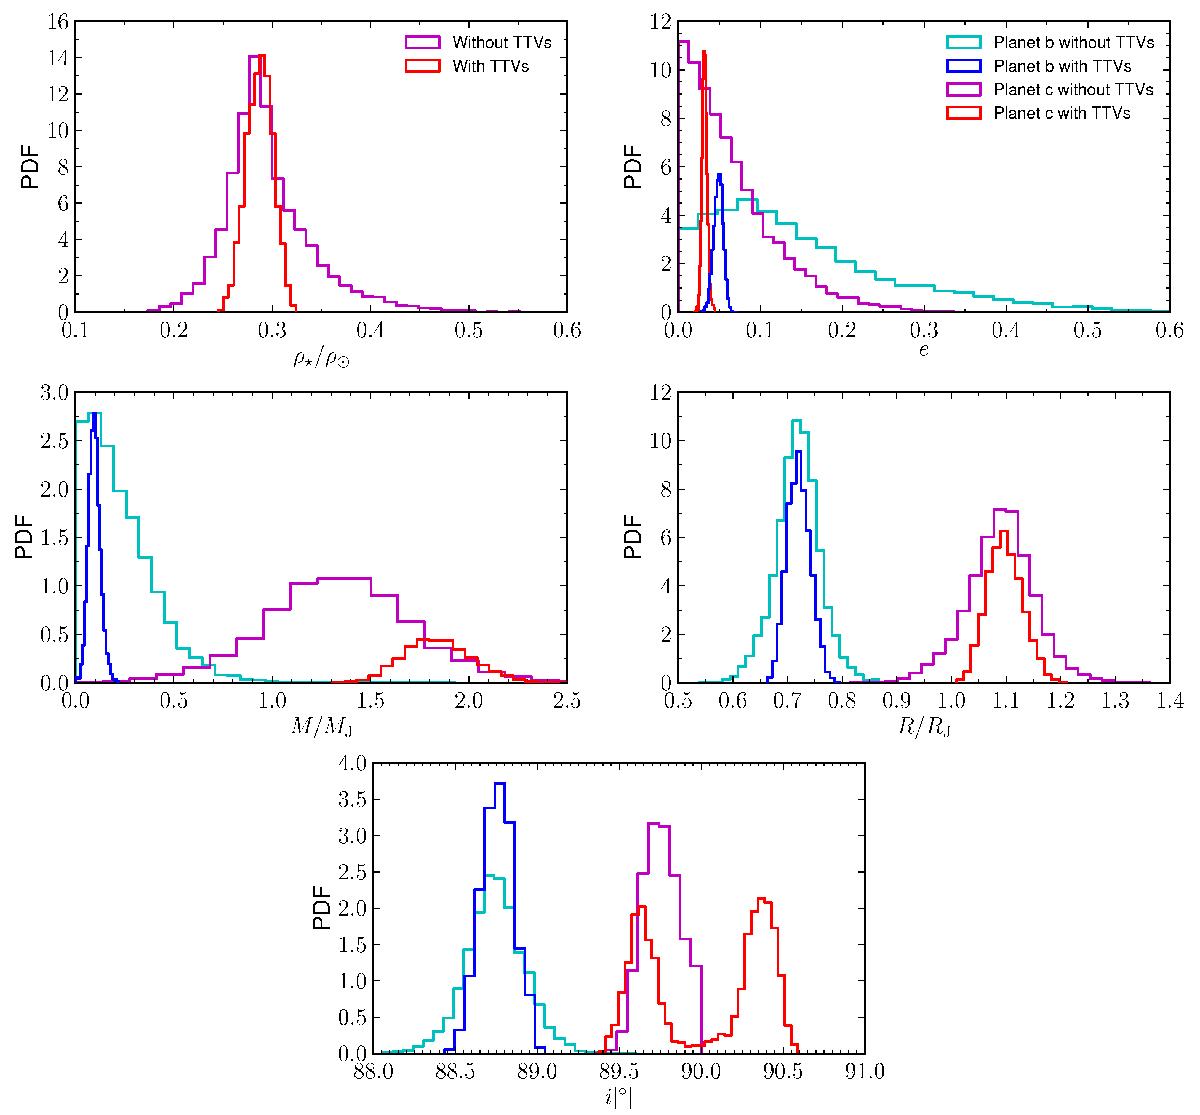
Upper left: probability density function (PDF) of the stellar density including or excluding the TTVs; to make the plot more readable, the PDF using the TTVs is divided by 2. The prior from spectroscopy (HIRES, Dartmouth) is shown for comparison. Upper right: the planetary eccentricities from different sets of data; the PDF using the TTVs is divided by 12. The color code is the same in the following plots. Central line: planetary masses and radii from the fit with and without TTVs. The PDF of the masses using the TTVs is divided by 5, that of the radii by 2. Bottom: orbital inclinations from different sets of data.
Current usage metrics show cumulative count of Article Views (full-text article views including HTML views, PDF and ePub downloads, according to the available data) and Abstracts Views on Vision4Press platform.
Data correspond to usage on the plateform after 2015. The current usage metrics is available 48-96 hours after online publication and is updated daily on week days.
Initial download of the metrics may take a while.