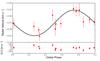
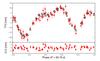
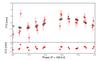
Fig. 4
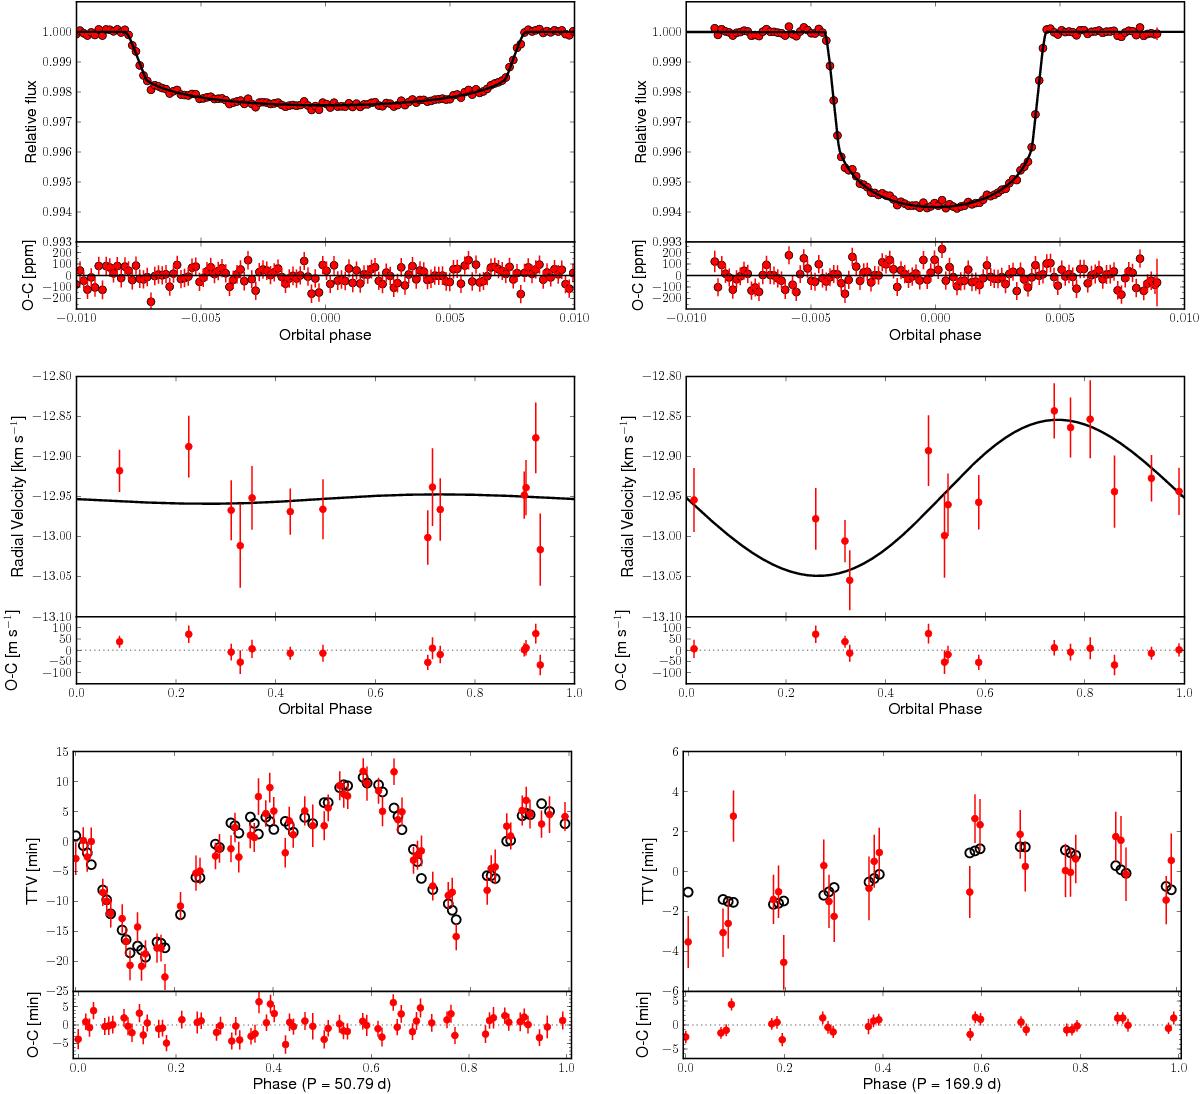
Top: phase-folded plot of the best transit model of planet b (left) and c (right), over the SC data. In black the model, in red the data binned every hundredth of orbital phase. Center: the same for the radial velocities. Bottom: the TTVs of planet b folded at the orbital period of planet c (left) and those of planet c folded at the first peak of its Lomb-Scargle periodogram (right, Sect. 5.1). For each plot, the lower panel shows the residuals as observed minus calculated (O−C) points.
Current usage metrics show cumulative count of Article Views (full-text article views including HTML views, PDF and ePub downloads, according to the available data) and Abstracts Views on Vision4Press platform.
Data correspond to usage on the plateform after 2015. The current usage metrics is available 48-96 hours after online publication and is updated daily on week days.
Initial download of the metrics may take a while.