Free Access
Fig. 2
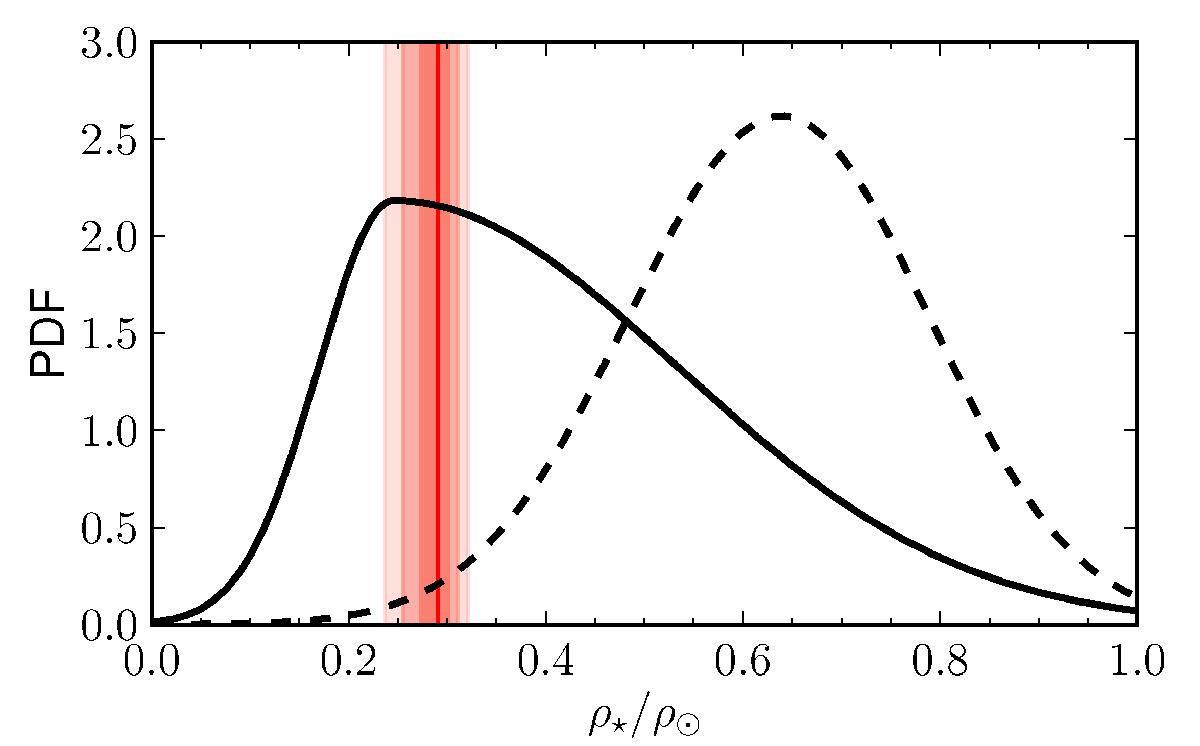
Stellar densities derived from the spectroscopic parameters of the SOPHIE spectrum (dashed line) and the HIRES spectrum (Rowe et al. 2014) (continuous line). In red, the posterior distribution from the PASTIS analysis, shaded according to the 1-, 2-, and 3σ intervals.
Current usage metrics show cumulative count of Article Views (full-text article views including HTML views, PDF and ePub downloads, according to the available data) and Abstracts Views on Vision4Press platform.
Data correspond to usage on the plateform after 2015. The current usage metrics is available 48-96 hours after online publication and is updated daily on week days.
Initial download of the metrics may take a while.