Fig. 8
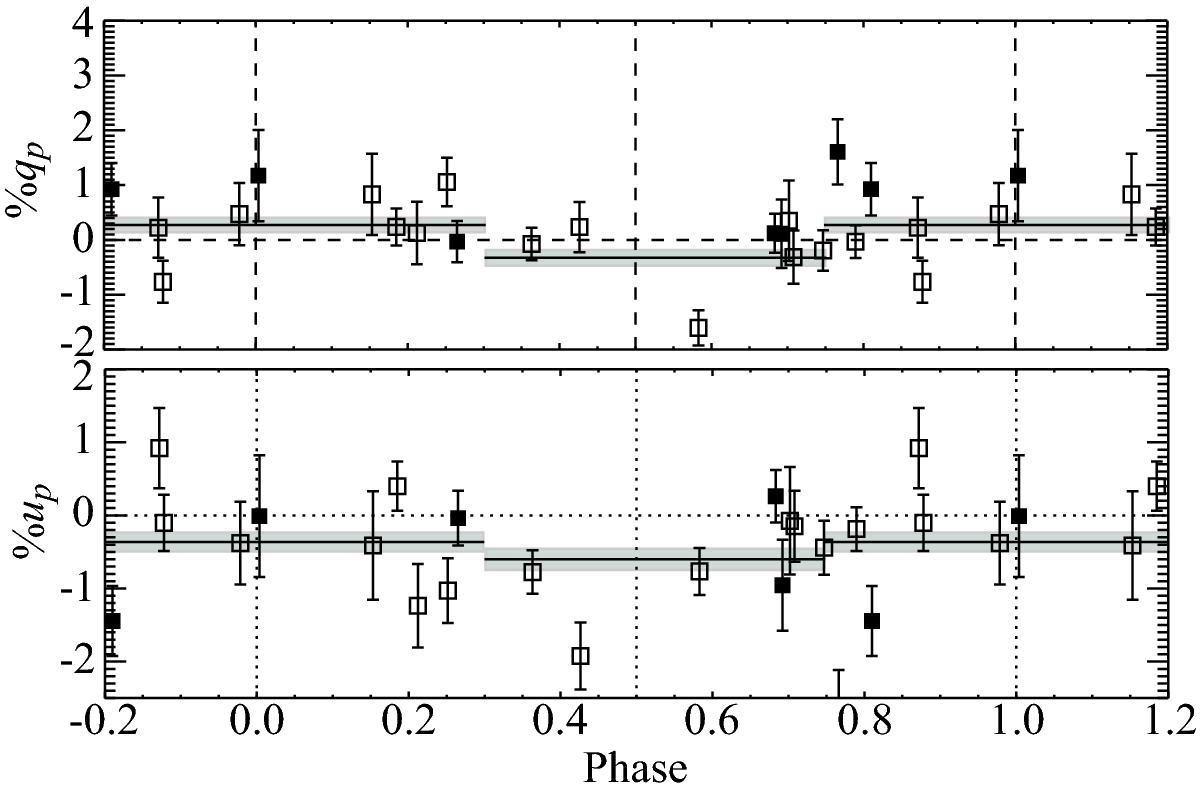
Data points represent the HeII λ4686 emission line polarization from HPOL at PBO (open squares) and HPOL at Ritter (filled squares). From top: projected %qp Stokes parameter and projected %up Stokes parameter versus phase (see text; rotated by −15°). The solid horizontal lines mark error-weighted mean values of %qp and %up for the phase regions they span; 1σ uncertainties are shown in gray. Dotted vertical lines represent phases 0.0, 0.5, and 1.0. Dotted horizontal lines mark zero in %qp and %up.
Current usage metrics show cumulative count of Article Views (full-text article views including HTML views, PDF and ePub downloads, according to the available data) and Abstracts Views on Vision4Press platform.
Data correspond to usage on the plateform after 2015. The current usage metrics is available 48-96 hours after online publication and is updated daily on week days.
Initial download of the metrics may take a while.