Fig. 7
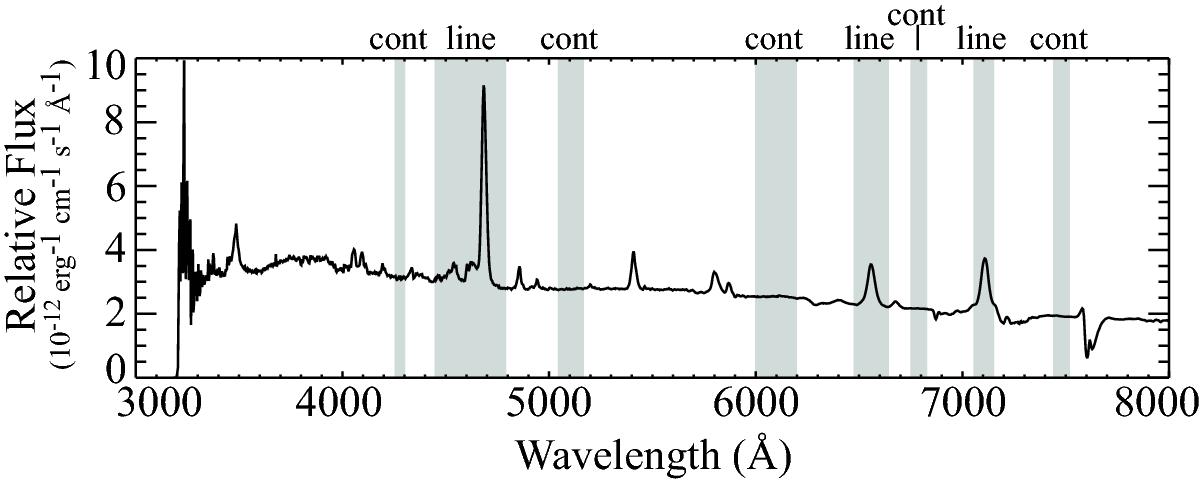
Relative total flux spectrum of V444 Cyg from 2012 Oct. 22 using the HPOL at Ritter instrument setup. Gray areas mark the line and continuum regions we used to calculated the line polarization with the flux equivalent width method (Sect. 3.3) for each observation. We determined the underlying continuum for each line using the shaded continuum regions immediately to its red and blue sides.
Current usage metrics show cumulative count of Article Views (full-text article views including HTML views, PDF and ePub downloads, according to the available data) and Abstracts Views on Vision4Press platform.
Data correspond to usage on the plateform after 2015. The current usage metrics is available 48-96 hours after online publication and is updated daily on week days.
Initial download of the metrics may take a while.