Fig. 6
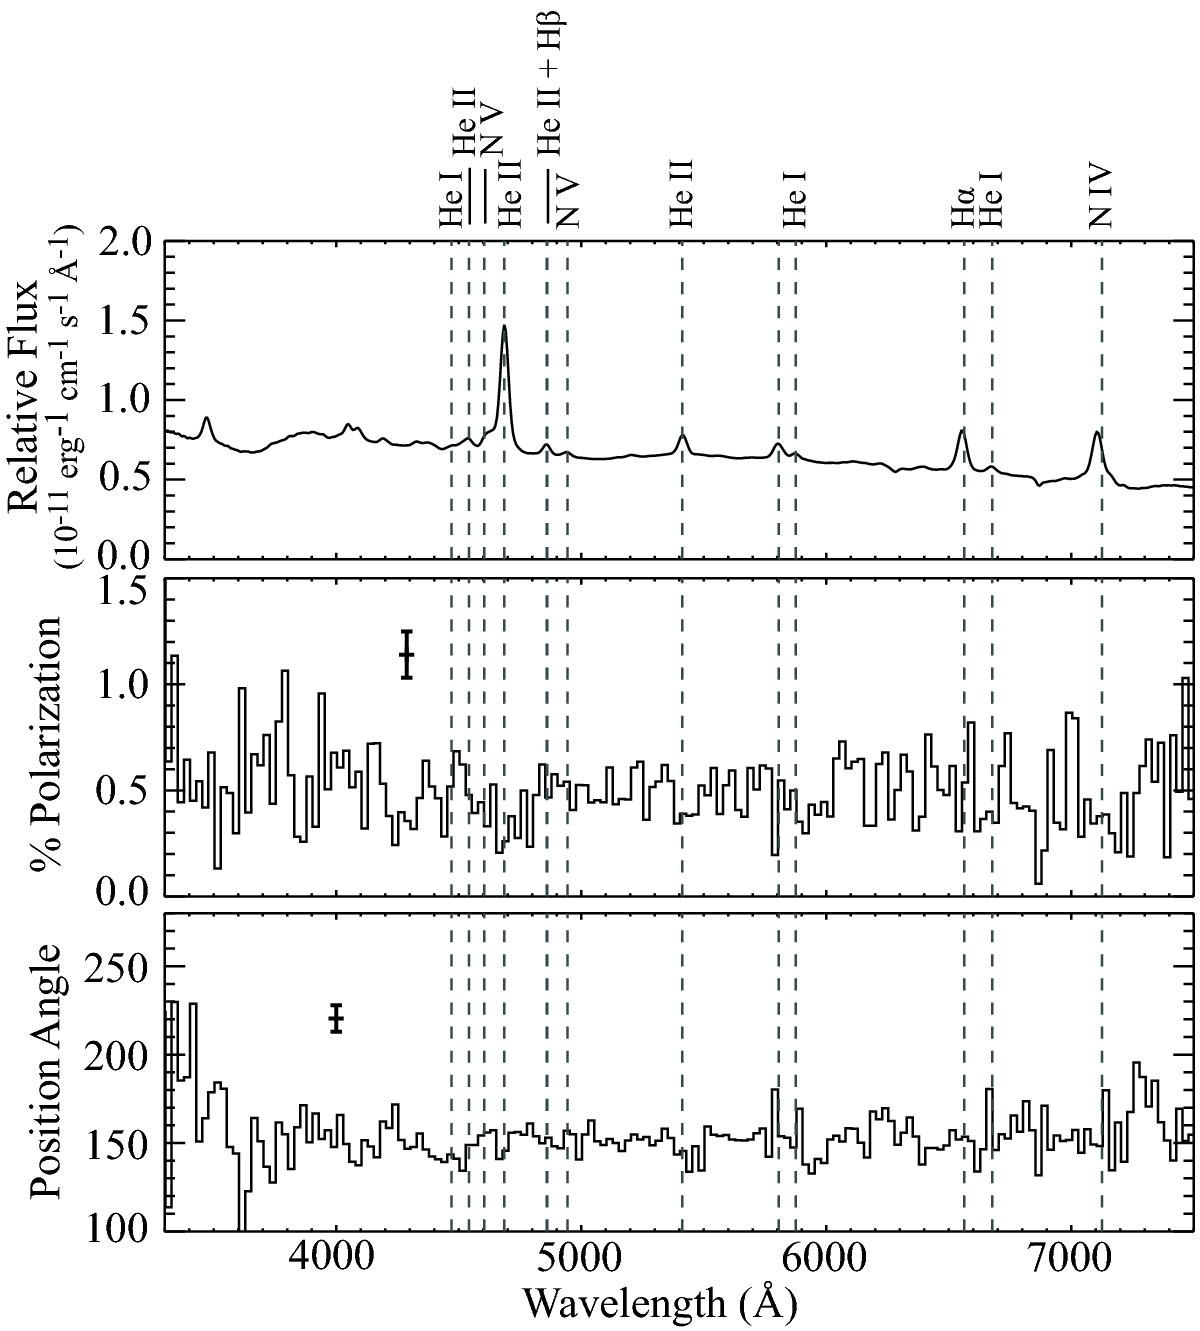
Error-weighted mean polarization spectrum for HPOL at PBO observations between phases 0.6 and 0.75. From top: relative flux, percent polarization, and position angle (degrees) versus wavelength. Gray dashed lines indicate identified emission lines. The polarization and position angle data have been binned to 25 Å. Error bars shown are the average polarization and position angle errors for the spectrum.
Current usage metrics show cumulative count of Article Views (full-text article views including HTML views, PDF and ePub downloads, according to the available data) and Abstracts Views on Vision4Press platform.
Data correspond to usage on the plateform after 2015. The current usage metrics is available 48-96 hours after online publication and is updated daily on week days.
Initial download of the metrics may take a while.