Fig. 5
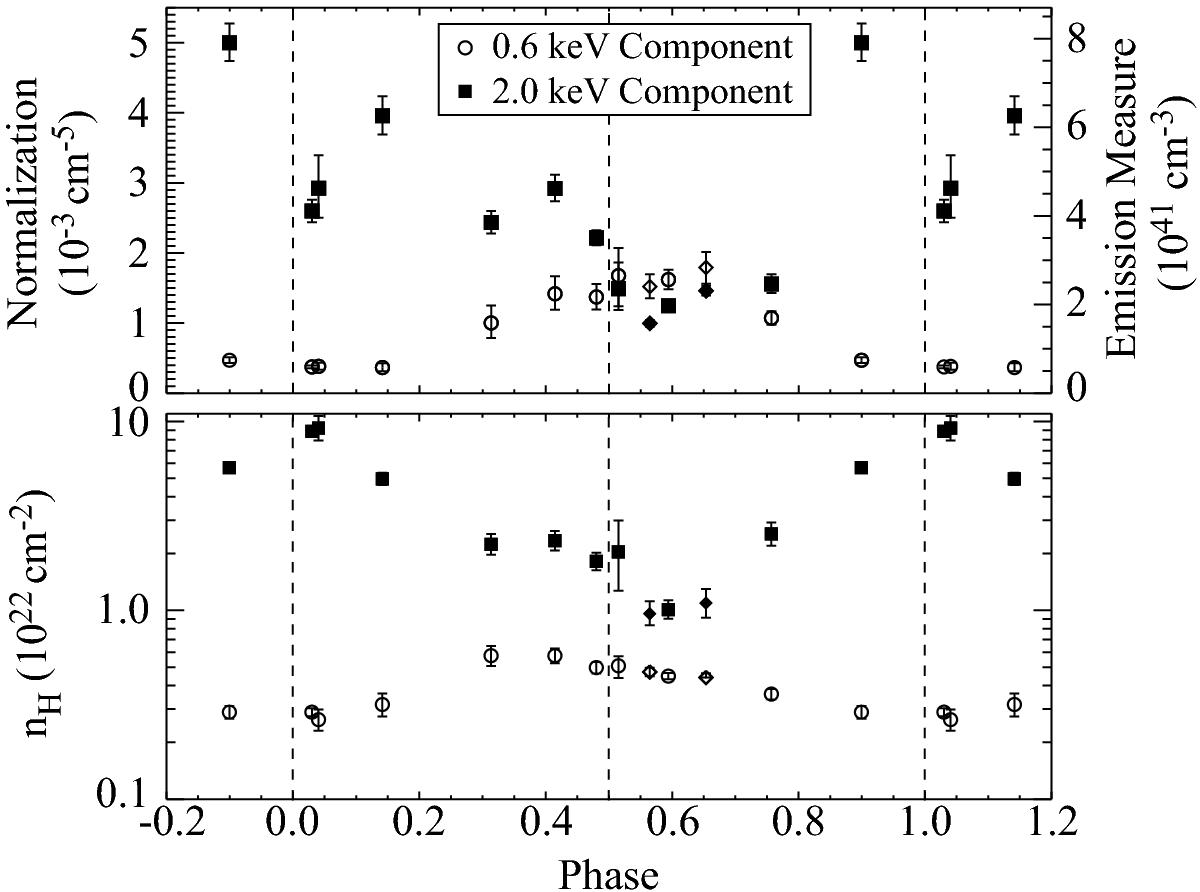
Normalization (top) and absorption column density (nH; bottom; y axis is log scale) parameters from our spectral fitting of the XMM-Newton observations as functions of phase. Circles (0.6 keV component) and filled squares (2.0 keV component) represent the two different model components. In the case of observation 2272, we split the observation at phase 0.624 as well as fitting the whole observation (Sect. 3.1). Diamonds (open = 0.6 keV, closed = 2.0 keV) represent the two data sets derived from this split. Points are plotted in phase at the midpoint of each observation. Dotted vertical lines represent phases 0.0, 0.5, and 1.0. All data have been wrapped in phase so that more than one complete cycle is shown.
Current usage metrics show cumulative count of Article Views (full-text article views including HTML views, PDF and ePub downloads, according to the available data) and Abstracts Views on Vision4Press platform.
Data correspond to usage on the plateform after 2015. The current usage metrics is available 48-96 hours after online publication and is updated daily on week days.
Initial download of the metrics may take a while.