Fig. 4
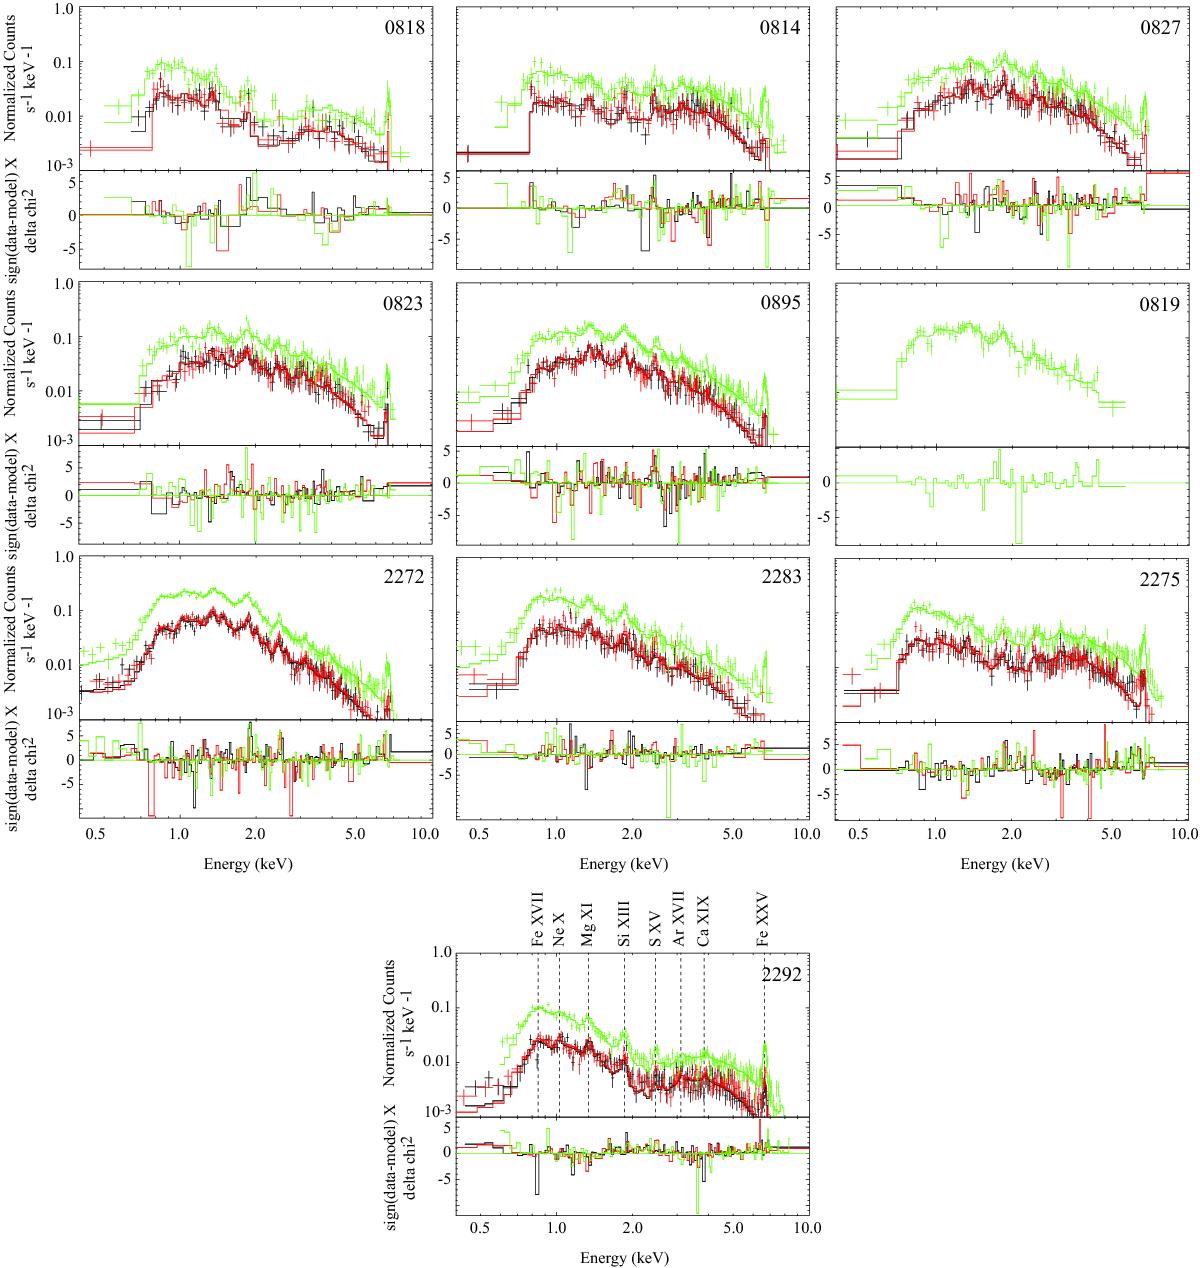
XMM-Newton EPIC spectra. Green (PN), red (MOS2), and black (MOS1) points represent observed data from the different detectors within the EPIC instrument. The solid lines in the same colors represent the XSPEC model fits discussed in Sect. 3.1. Spectra are indicated by their revolution number and arranged in phase order increasing from left to right across each row. Emission lines are identified in spectrum 2292.
Current usage metrics show cumulative count of Article Views (full-text article views including HTML views, PDF and ePub downloads, according to the available data) and Abstracts Views on Vision4Press platform.
Data correspond to usage on the plateform after 2015. The current usage metrics is available 48-96 hours after online publication and is updated daily on week days.
Initial download of the metrics may take a while.