Free Access
Fig. 2
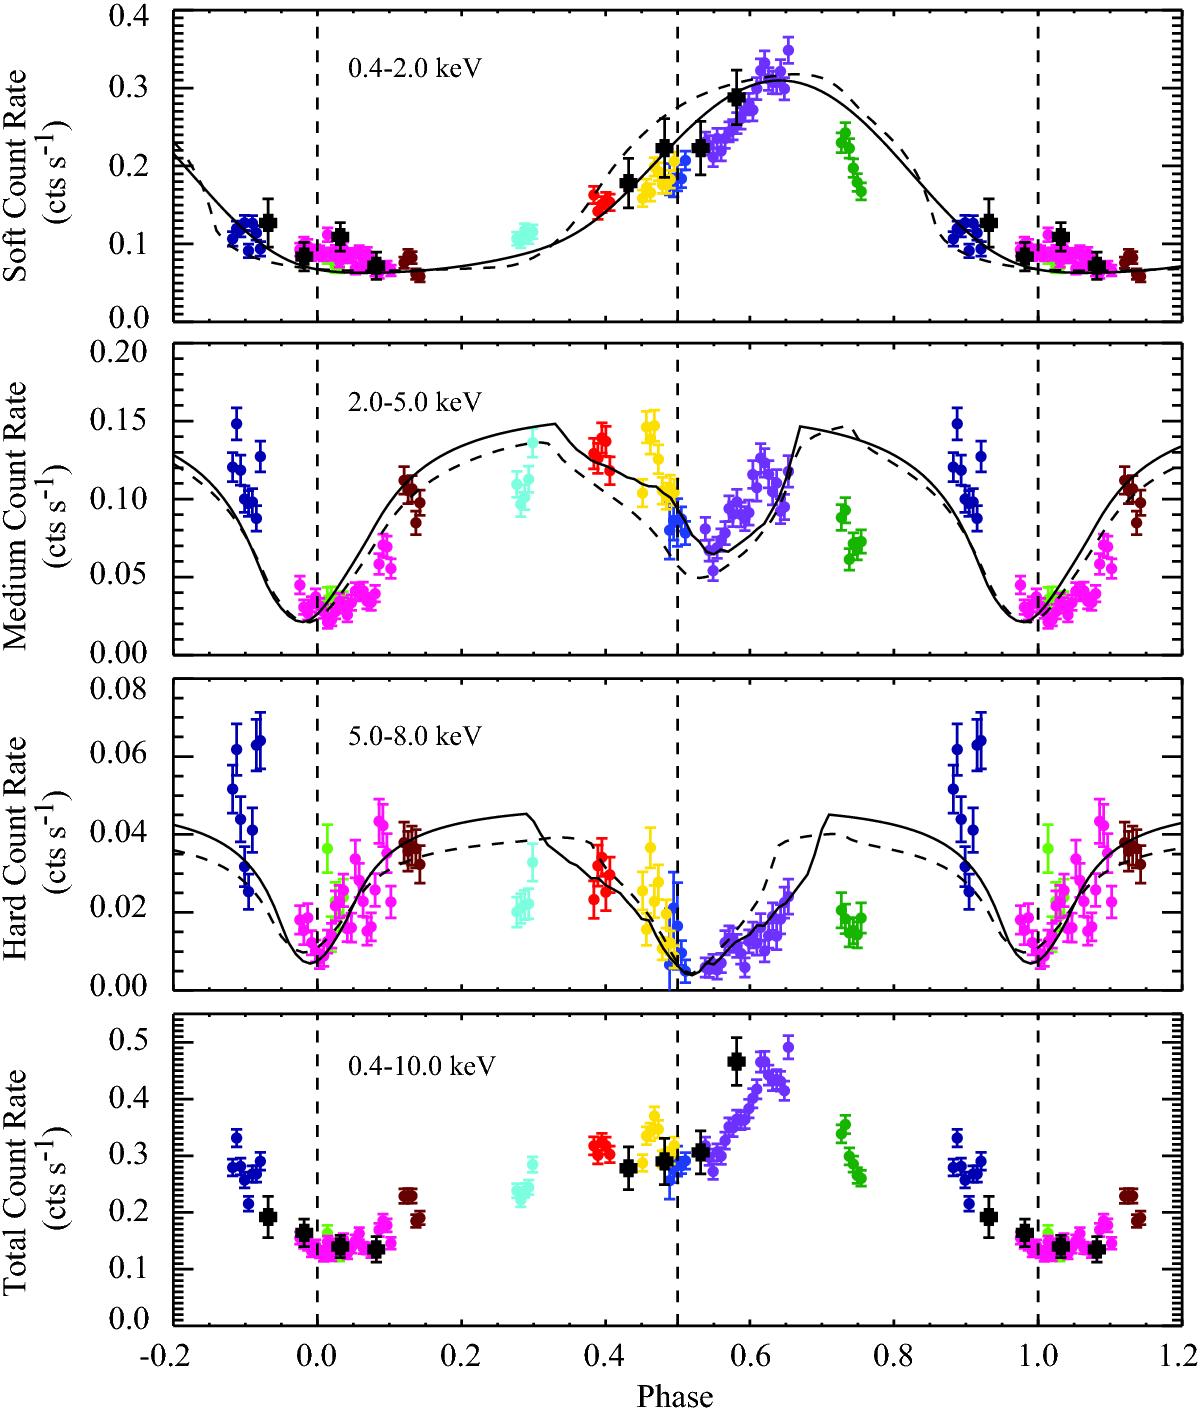
Same as Fig. 1, but for the XMM-Newton PN camera. The solid lines in the top three panels represent the results of our occultation plus WN-wind absorption model fits, while the dashed lines represent simulated light curves for the two-wind plus shock cone models (Sect. 4.1).
Current usage metrics show cumulative count of Article Views (full-text article views including HTML views, PDF and ePub downloads, according to the available data) and Abstracts Views on Vision4Press platform.
Data correspond to usage on the plateform after 2015. The current usage metrics is available 48-96 hours after online publication and is updated daily on week days.
Initial download of the metrics may take a while.