Fig. 13
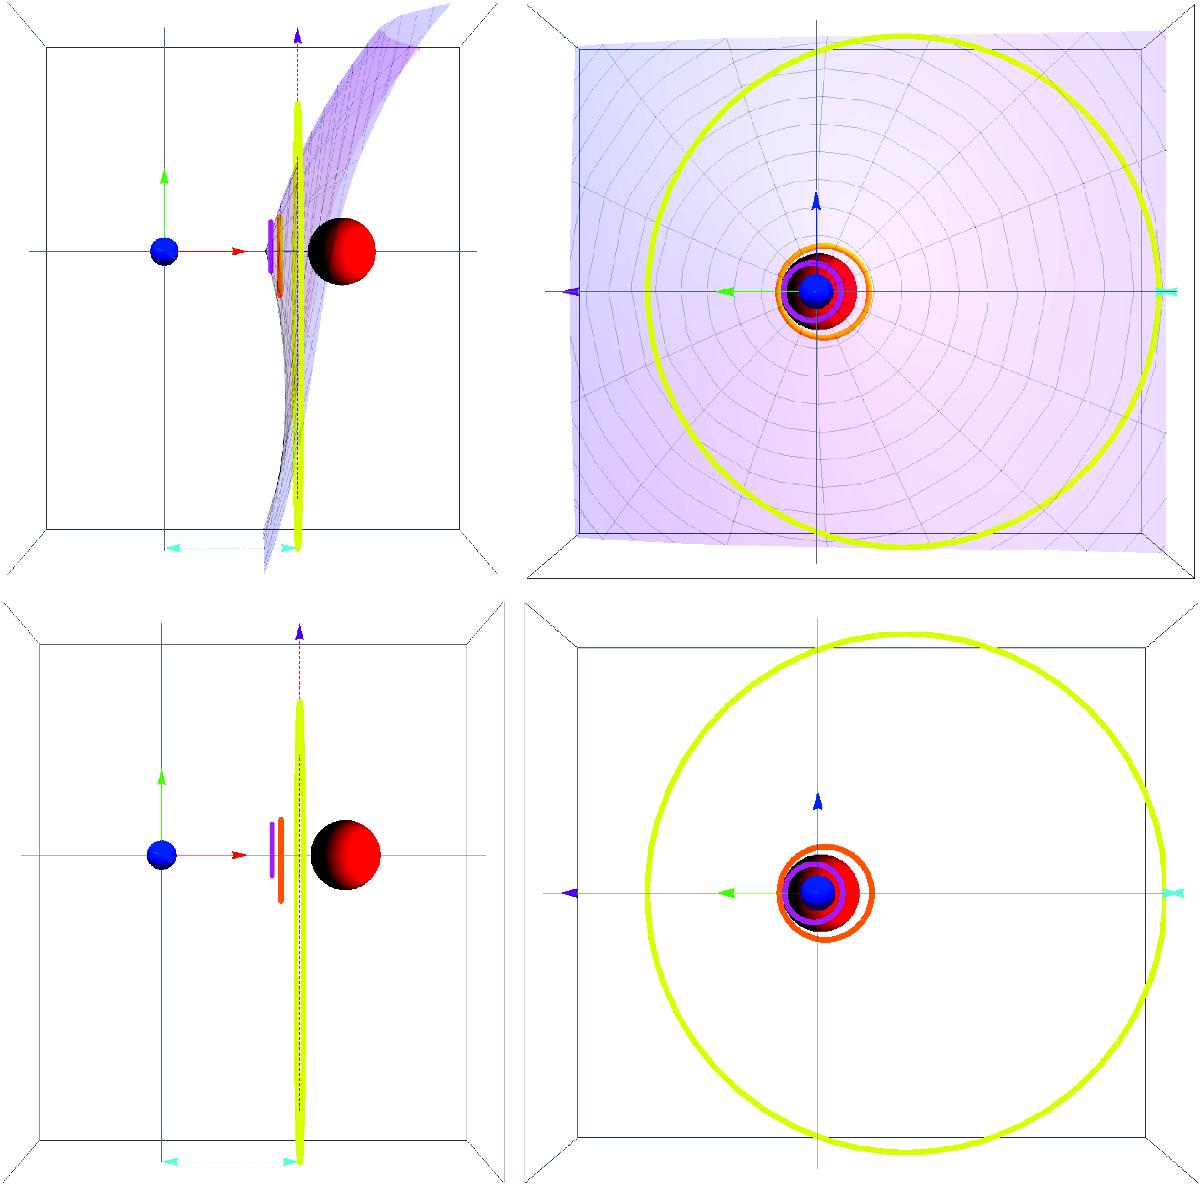
Top view (left) and side view at superior conjunction (right) of the locations and sizes of the optimal circles of emission for the soft (yellow), medium (orange), and hard (magenta) bands. The red, green, and blue arrows along the axes signify the x-, y-, and z-axes, respectively. The cyan and purple lines have the same meaning as Fig. 12. The shaded region represents a shock cone with a half-opening angle α = 75° and an apex at p = 0.57a. In the bottom row we remove the 3D structure of shock cone for comparison.
Current usage metrics show cumulative count of Article Views (full-text article views including HTML views, PDF and ePub downloads, according to the available data) and Abstracts Views on Vision4Press platform.
Data correspond to usage on the plateform after 2015. The current usage metrics is available 48-96 hours after online publication and is updated daily on week days.
Initial download of the metrics may take a while.