Fig. 6
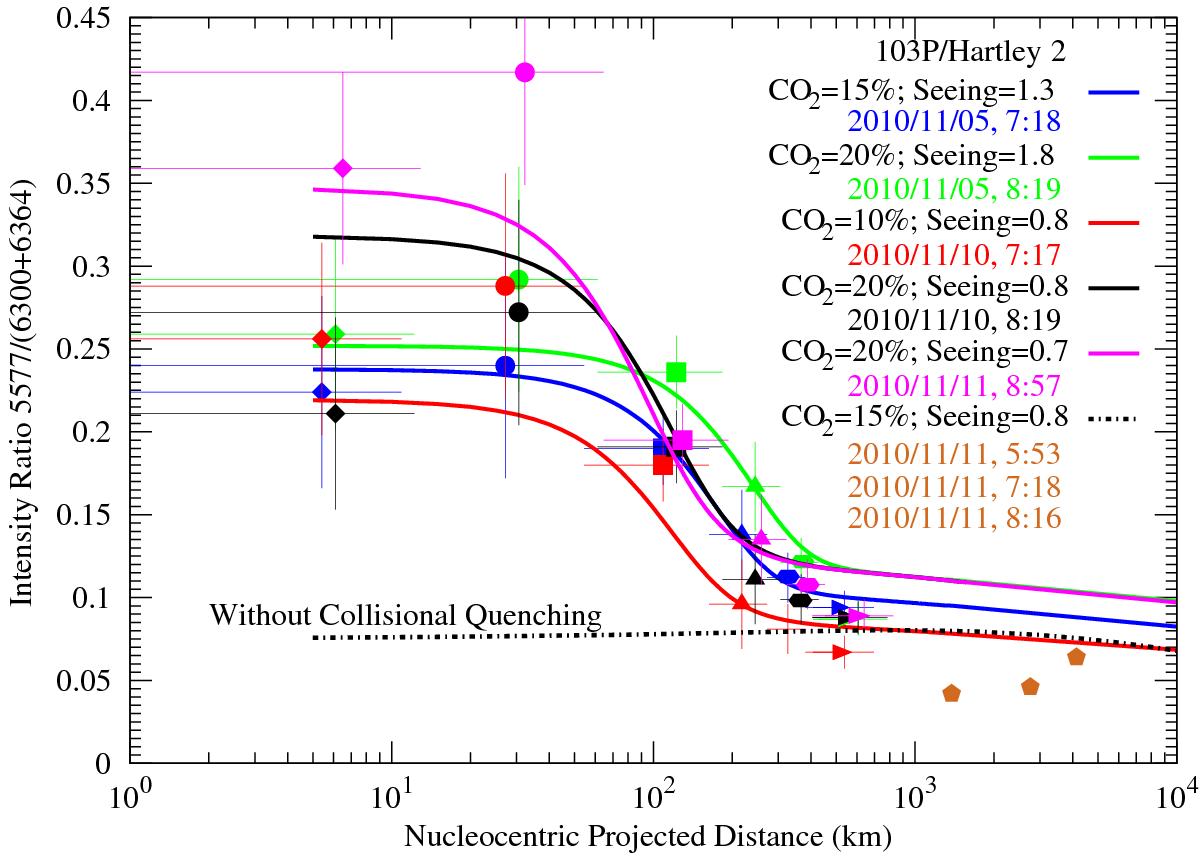
G/R ratio for each subslit and offset spectrum for comet 103P/Hartley 2. The range of nucleocentric distances covered by each point and the error on the G/R ratio are represented. The model-calculated G/R ratios as a function of projected distance are plotted. An H2O production rate of 1.18 × 1028 s-1 and 0.5% CO as relative abundance were used with different seeing values and different CO2 relative abundances. The fits give the CO2 relative abundance of the comet. The black dash-dotted curve represents the calculated G/R ratio not accounting for collisional quenching with 15% CO2 relative abundance. The pentagon symbols are the data points for the offset observations.
Current usage metrics show cumulative count of Article Views (full-text article views including HTML views, PDF and ePub downloads, according to the available data) and Abstracts Views on Vision4Press platform.
Data correspond to usage on the plateform after 2015. The current usage metrics is available 48-96 hours after online publication and is updated daily on week days.
Initial download of the metrics may take a while.